|
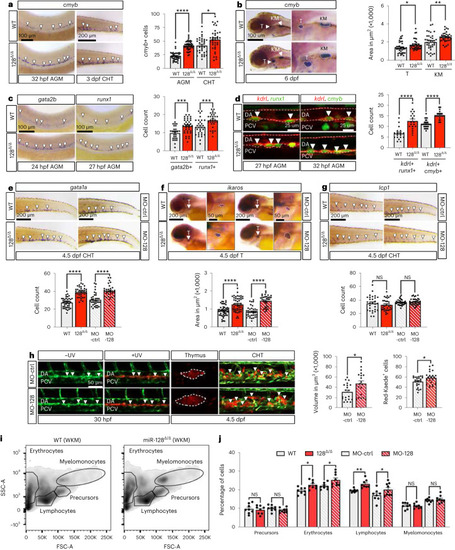
nHSPC development and blood lineages are altered in miR-128Δ/Δ. a, WISH against cmyb at 32 hpf and 3 dpf in WT or miR-128Δ/Δ (128Δ/Δ) AGM (n = 39 (WT) and 42 (128Δ/Δ) embryos; P < 0.0001) and CHT (n = 33 (WT) and 48 (128Δ/Δ) embryos; P = 0.0151) (3 independent experiments, two-tailed Mann–Whitney test). b, WISH against cmyb at 6 dpf in WT (thymus n = 36 and KM n = 36 embryos; P = 0.0133) and 128Δ/Δ (thymus n = 35 and KM n = 36 embryos; P = 0.0033; 3 independent experiments; two-tailed Mann–Whitney test). c, WISH against gata2b (n = 27 (WT) and 35 (128Δ/Δ) embryos; P = 0.0005) and runx1 (n = 32 (WT) and 30 (128Δ/Δ) embryos; P = 0.0009; 3 independent experiments; two-tailed Mann–Whitney test). d, Confocal images of Tg(kdrl:mCherrys896,cmyb:GFPzf169) (n = 18 (WT) and 19 (128Δ/Δ) embryos; P < 0.0001) and Tg(kdrl:mCherrys896,runx1:GFPy509) (n = 29 (WT) and 31 (128Δ/Δ) embryos; P < 0.0001) AGM at 27 and 32 hpf, respectively. Quantification represents runx1+, kdrl+ (hemECs) and cmyb+, kdrl+ (nHSPCs) cells (3 independent experiments; two-tailed Mann–Whitney test). e–g, WISH of gata1a (n = 40 (WT), 37 (128Δ/Δ), 34 (MO-ctrl) and 31 (Mo-128) embryos; P < 0.0001) (e), ikaros (n = 48 (WT); 48 (128Δ/Δ), 37 (MO-ctrl) and 34 (Mo-128) embryos; P < 0.0001) (f) and lcp1 (n = 29 (WT), 32 (128Δ/Δ), 36 (MO-ctrl), 38 (Mo-128) embryos; P = 0.0511 and 0.4257) (g) at 4.5 dpf with their quantification (3 independent experiments; two-tailed Mann–Whitney test). h, Confocal live imaging of Tg(fli1a:Gal4ubs4,UAS:Kaederk8), ± UV (photoconversion) in the AGM. Quantification represents the red thymus area (MO-ctrl, 20; Mo-128, 19 embryos; P = 0.0151) and the number of red cells in the CHT (MO-ctrl, 19; Mo-128, 22 embryos; P = 0.0462; 3 independent experiments; two-tailed Mann–Whitney test). i, Flow cytometry analysis of 1-month-old dissected whole (W)KM WT, 128Δ/Δ. j, Quantification of cell population identified by flow cytometry (n = 8 (WT), 8 (128Δ/Δ), 8 (MO-ctrl) and 9 (MO-128) zebrafish; two-way ANOVA with multiple comparisons). All quantifications are represented with mean ± s.e.m. NS, not significant: P > 0.05, *P ≤ 0.05, **P ≤ 0.01, ***P ≤ 0.001, ****P ≤ 0.0001. Arrowheads indicate cells stained by WISH and IF and cells photoconverted in h. T, thymus; DA, dorsal aorta; PCV, posterior cardinal vein; SSC-A, side scatter A; FSC-A, forward scatter A. Source data
|