FIGURE

Figure 1

ID
ZDB-FIG-230814-2
Publication
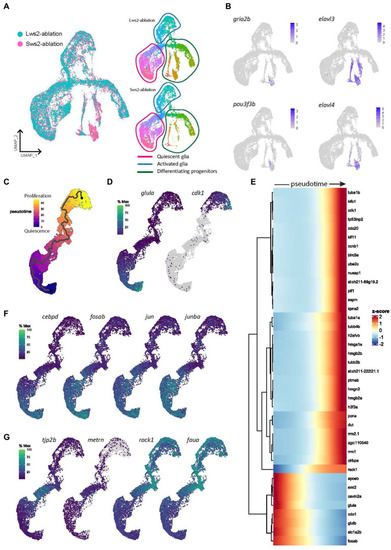
Krylov et al., 2023 - Heterogeneity in quiescent Müller glia in the uninjured zebrafish retina drive differential responses following photoreceptor ablation
Other Figures
All Figure Page
Back to All Figure Page
Figure 1

Gene expression modules in activated Müller glia following photoreceptor ablation. (A) UMAP plot of integrated Lws2 and Sws2-ablation scRNA-seq samples. (B) Differences in clusters between photoreceptor ablation samples is associated with differentiating Müller glia-derived progenitor cells. (C,D) Trajectory of integrated dataset along pseudotime from quiescent (glula) to late proliferating (cdk1) Müller glia. (E) Heatmap showing the top 40 differentially expressed genes along pseudotime from left to right, grouped together by gene modules. (F,G) Expression plots of differentially expressed markers along pseudotime.

Expression Data

Expression Detail
Antibody Labeling
Phenotype Data

Phenotype Detail
Acknowledgments
This image is the copyrighted work of the attributed author or publisher, and ZFIN has permission only to display this image to its users. Additional permissions should be obtained from the applicable author or publisher of the image. Full text @ Front. Mol. Neurosci.