FIGURE

Fig. 4.

ID
ZDB-FIG-230617-52
Publication
Dokmegang et al., 2021 - Quantification of cell behaviors and computational modelling show that cell directional behaviors drive zebrafish pectoral fin morphogenesis
Other Figures
All Figure Page
Back to All Figure Page
Fig. 4.

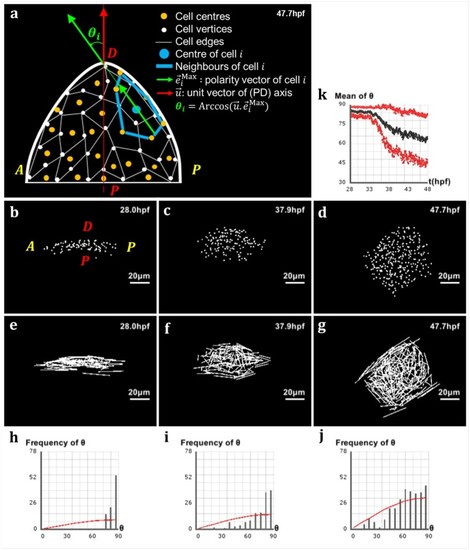
Analysis of directional cell behaviors in the zebrafish pectoral fin. (a) Schematics in 2D of the method used to analyze directional cell behaviors: for each cell i, ฮธi denotes the polarity angle that this cell forms between its elongation axis ๐‘’โ†’Max๐‘– (extracted from the maximum eigenvalue of the covariance matrix of its neighborhood ๐’ฉ๐‘–) and the PD axis ๐‘ขโ†’. (bโ€“d) Lateral view of the pectoral fin at different stages of development, respectively ๐‘ก=28.0 hpf, ๐‘ก=37.9 hpf and ๐‘ก=47.7 hpf. (eโ€“g) Vector field of the cellsโ€™ elongation axes ๐‘’โ†’Max๐‘– in the pectoral fin at the same stages. (hโ€“j) Distribution of the polarity angles ฮธi of the cells in the pectoral fin at the same stages, compared with the standard distribution of random angles formed by two arbitrary vectors in 3D (red curve). (k) Evolution over time of the average polarity angle ๐œƒโŽฏโŽฏ of the fin cells ยฑ its standard deviation ฮ”ฮธ shown in red

Expression Data

Expression Detail
Antibody Labeling
Phenotype Data

Phenotype Detail
Acknowledgments
This image is the copyrighted work of the attributed author or publisher, and ZFIN has permission only to display this image to its users. Additional permissions should be obtained from the applicable author or publisher of the image. Full text @ Bioinformatics