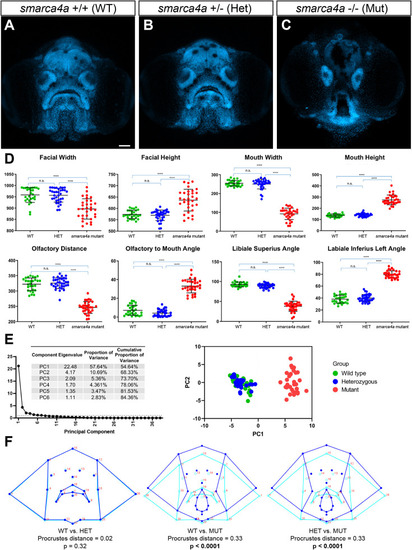
zFACE analysis of zebrafish with loss of smarca4a. (A-C) Confocal images of wild-type (WT; A), heterozygous (Het; B) and homozygous mutant (Mut; C) smarca4a larvae. (D) zFACE analysis pinpointed 33 significantly altered facial measurements between the groups, with examples of dimensions that were unaltered, decreased and increased shown. The numbers of larvae analyzed for each group were n=28 for WT, n=34 for Het and n=32 for Mut. ****P<0.0001; n.s., not significant (one-way ANOVA). (E) Untransformed zFACE features were subjected to multivariate statistical testing using PCA. The first two components explained 68% of the variance in the dataset, and the principal component (PC) plot showed clear separation of the homozygous mutant group from the WT and heterozygote groups. (F) Discriminant function analysis after landmark data were Procrustes transformed further supported that smarca4a homozygous mutants had different average facial shapes compared to either WT or heterozygous larvae, whereas WT and heterozygous groups had the same facial shape. Wireframe representations of facial shapes highlight the alterations to landmarks in the upper face, eyes, oral cavity, midface and lower jaw in the homozygous smarca4a mutants [discriminant function analysis (DFA)]. Scale bar: 50 µm.
|
