
Fig. 1
- ID
- ZDB-FIG-230608-1
- Publication
- Palermo et al., 2023 - Variant-to-gene mapping followed by cross-species genetic screening identifies GPI-anchor biosynthesis as a regulator of sleep
- Other Figures
- All Figure Page
- Back to All Figure Page
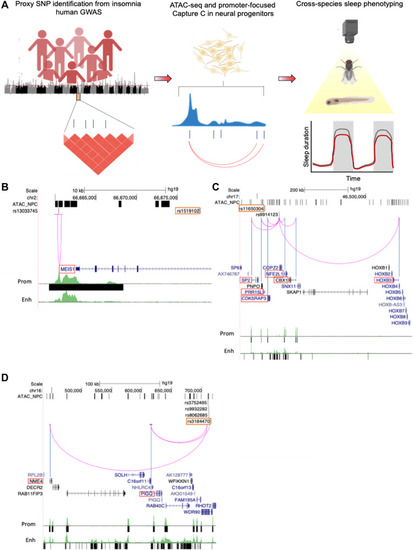
Translating human GWAS signals to functional outcomes with variant-to-gene mapping.
(A) Leveraging existing insomnia human GWAS loci, we identified proxy SNPs in strong linkage disequilibrium with sentinel SNPs using both genome-wide ATAC-seq and high-resolution promoter-focused Capture C data from iPSC-derived NPCs and then performed high-throughput sleep and activity screening using Drosophila RNAi lines with confirmation in a vertebrate zebrafish (Danio rerio) model. (B to D) Three examples of chromatin loops linking insomnia associate SNPs to candidate effector genes in NPCs. (B) rs13033745 [coefficient of determination (r2) with sentinel SNP rs1519102 = 0.84] loops to the MEIS1 promoter region. (C) rs9914123 (r2 with sentinel SNP rs11650304 = 0.76) loops to the promoters of SP2, PRR15L, CDK5RAP3, NFE2L1, CBX1, and HOXB3 in a ~700-kb region. (D) rs3752495, rs8062685, and rs9932282 (r2 with sentinel SNP rs3184470 = ~1) loop to the promoters of PIG-Q, NHLRC4, and NME4. Orange box, sentinel SNP. Black bars, open chromatin peaks from ATAC-seq. Magenta arcs, chromatin loops from promoter-focused Capture C. Neuronal enhancer and promoter tracks are from (81). |