Figure 6
- ID
- ZDB-FIG-230530-14
- Publication
- Kim et al., 2023 - Non-Invasive Monitoring of Cutaneous Wound Healing in Non-Diabetic and Diabetic Model of Adult Zebrafish Using OCT Angiography
- Other Figures
- All Figure Page
- Back to All Figure Page
|
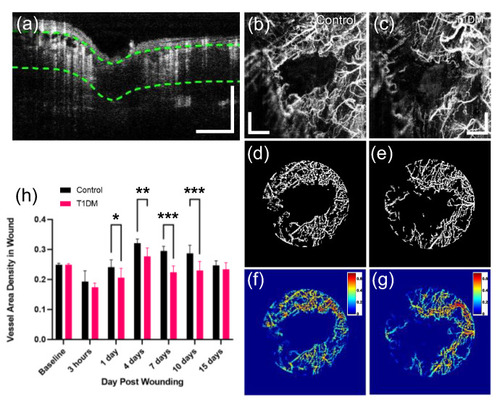
(a) Representative cross-sectional OCTA image of a 3D OCTA dataset. Based on the dataset, an OCTA slab is extracted at the depth range (green dotted lines), including the vascularized tissue under the epidermis. (b,c) MIP images of the extracted OCTA slabs in the control and diabetic zebrafish models. (d,e) Binary image of the wound area selectively cropped from (b,c). (f,g) Wound vessel area density (VAD) map calculated with (d,e). (h) The wound VADs (mean ± SEM) at different time points in non-diabetic (control) and diabetic groups. Significance levels are * p < 0.03, ** p < 0.003, and *** p < 0.001. Scale bars: 500 μm. |

