
Figure 4
- ID
- ZDB-FIG-230518-6
- Publication
- McConnell et al., 2023 - Immune gene variation associated with chromosome-scale differences among individual zebrafish genomes
- Other Figures
- All Figure Page
- Back to All Figure Page
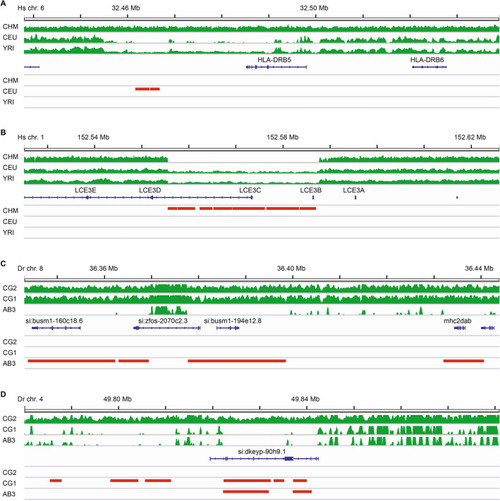
Zero coverage regions highlight unique haplotypes. Selected 100 kb region plots including (A) HLA-DRB5 gene on human chromosome 6, (B) LCE3C gene on human chromosome 1, (C) mhc2dab gene on zebrafish chromosome 8, and (D) NLR gene (si:dkeyp-90h9.1) on zebrafish chromosome 4. Plots show mapped sequence read coverage across each region in green. Zero Coverage Regions (no mapped reads over ≥ 2 kb intervals) are displayed in red. Representative examples shown here were selected due to different patterns of coverage for individuals of the same species, indicating the presence of an alternative haplotype at that locus. We note similar findings indicating alternative haplotypes for additional immune gene loci throughout the zebrafish genome, including MHC Class I genes on chromosome 25 and NLR genes on chromosomes beyond chromosome 4, as highlighted in Fig. S2. |