
Fig. 3
- ID
- ZDB-FIG-230325-34
- Publication
- Myren-Svelstad et al., 2022 - Elevated photic response is followed by a rapid decay and depressed state in ictogenic networks
- Other Figures
- All Figure Page
- Back to All Figure Page
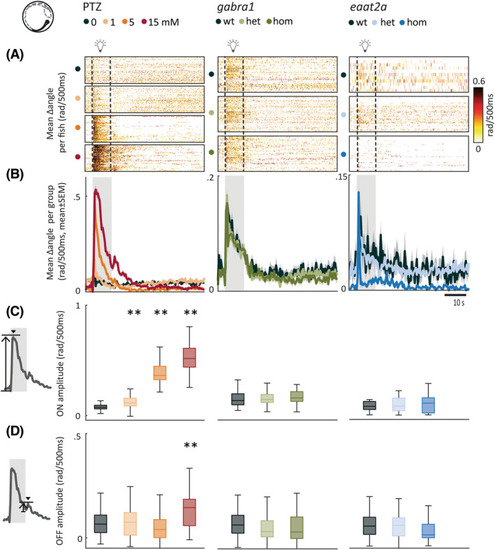
Photic stimulation leads to model‐dependent change in swim angle. (A) Mean change in swim angle in response to 10‐s photic stimulation with 5‐min interstimulus interval. Each line in heatmaps represents the average across five trials for one fish. Dashed lines indicate the start and end of 10‐s photic stimulation. (B) Mean change in swim angle per subgroup. Gray shaded area indicates photic stimulation. (C) Light‐on amplitude measured as maximum change in swim angle during first 5 s after light onset. (D) Light‐off amplitude measured as the maximum change in swim angle during the first 5 s after light offset. Total sample size for pentylenetetrazole (PTZ) model: control, n = 42; 1 mmol·L−1, n = 42; 5 mmol·L−1, n = 41; 15 mmol·L−1, n = 41; for gabra1 model: wild‐type (wt), n = 39; heterozygous (het), n = 81; homozygous (hom), n = 48; for eaat2a model: wt, n = 11; het, n = 41; hom, n = 42. **p < .01 by Wilcoxon rank‐sum test. Shaded regions associated with individual colors represent SEM of each group. Boxplots represent median with interquartile ranges; whiskers extend to the most extreme data points that are not outliers |