
FIGURE
Figure 6
- ID
- ZDB-FIG-230305-17
- Publication
- Liu et al., 2023 - Enhanced insulin activity achieved in VDRa/b ablation zebrafish
- Other Figures
- All Figure Page
- Back to All Figure Page
Figure 6
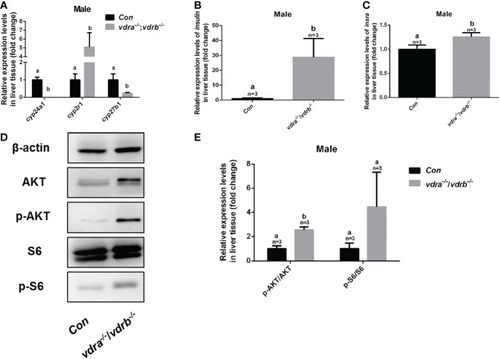
Enhanced insulin signaling observed in vdra-/- ;vdrb-/- zebrafish. (A) Quantitative real-time PCR showed the cyp24a1, cyp2r1 and cyp27b1 transcript levels in the liver of vdra-/;vdrb-/- fish and control siblings at 100 dpf; (B, C) Quantitative real-time PCR showed the insulin and insra, transcriptional levels in the liver of vdra-/;vdrb-/- fish and control siblings at 100 dpf; (D) AKT, p-AKT, S6, and p-S6 protein levels in liver samples of vdra-/-;vdrb-/- fish and control siblings at 100 dpf; (E) Quantification of relative p-AKT/AKT and p-S6/S6 protein levels from western blot analysis. |
Expression Data
Expression Detail
Antibody Labeling
Phenotype Data
Phenotype Detail
Acknowledgments
This image is the copyrighted work of the attributed author or publisher, and
ZFIN has permission only to display this image to its users.
Additional permissions should be obtained from the applicable author or publisher of the image.
Full text @ Front Endocrinol (Lausanne)