
Fig. 3
- ID
- ZDB-FIG-230226-36
- Publication
- Tang et al., 2022 - Single-cell resolution of MET- and EMT-like programs in osteoblasts during zebrafish fin regeneration
- Other Figures
- All Figure Page
- Back to All Figure Page
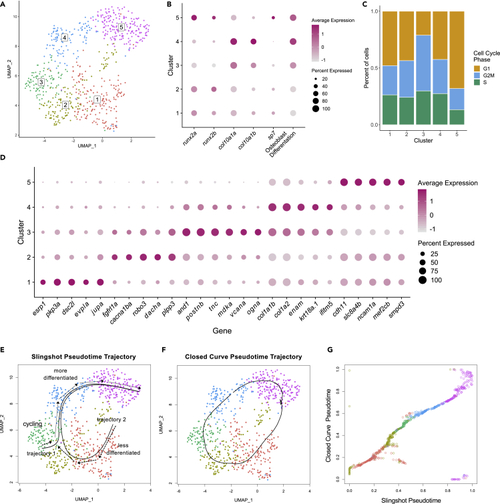
Clustering and trajectory analysis of osteoblast 2 population (A) UMAP plot showing five distinct osteoblastic subclusters. (B) Dotplot visualizing expression of known genes marking the different stages of osteoblast differentiation and osteoblast differentiation scores. (C) Percentage of cells in each cell cycle phase for each osteoblast subcluster. (D) Dotplot showing selected genes found to be differentially expressed within each osteoblastic subcluster. (E–G) Pseudotemporal ordering of osteoblast 2 cells. (E) Slingshot pseudotime ordering yields two trajectories. Trajectory 1 starts in cluster 3, whereas trajectory 2 starts in cluster 1. (F) Closed curve analysis suggests a similar trajectory to trajectory 2 derived from Slingshot analysis. (G) Comparison of the closed curve trajectory to trajectory 2 derived from Slingshot shows that the orderings from open (Slingshot) and closed curve analyses are highly similar |