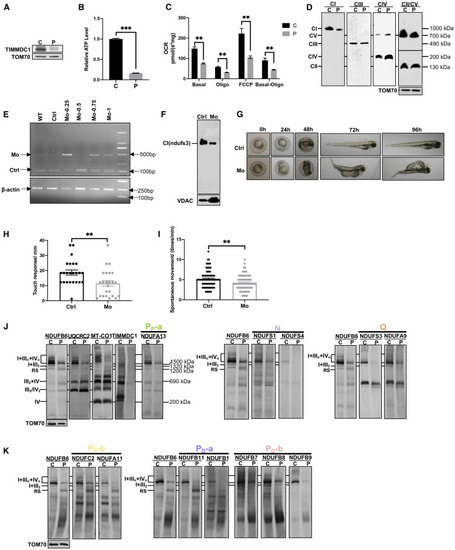
Figure 6. TIMMDC1 deficiency led to the accumulation of respirasome subcomplex in a patient sample
(A) Western blot analysis of the steady-state levels of TIMMDC1 in immortalized lymphocytes derived from patient (P) and asymptomatic mother (C). The level of TOM70 was used as an internal control (n = 3).
(B) Cellular ATP content in immortalized lymphocytes derived from patient (P) and his asymptomatic mother (C) was normalized to protein concentration (n = 3).
(C) Cell respiration was determined by measuring OCR in immortalized lymphocytes derived from patient (P) and his asymptomatic mother (C). Endogenous respiration was determined as follows: basal, basal cell respiration; oligo, the non-phosphorylating proton-leak respiration measured in the presence of oligomycin (2 μg/mL); FCCP, uncoupling respiration measured in the presence of FCCP (2.5 μM); basal-oligo, absolute respiration of ADP to ATP phosphorylation (n = 3).
(D) Blue-native PAGE (3.5%–16%) analysis of OXPHOS complexes using DDM-solubilized cell lysate in immortalized lymphocytes derived from patient (P) and his asymptomatic mother (C). Antibodies against NDUFA13, SDHA, UQCRC2, COX I, and ATP5A were used to detect complex I (CI), complex II (CII), complex III (CIII), complex IV (CIV), and complex V (CV), respectively. TOM70 was used as an internal control.
(E) PCR analysis of timmdc1 KD in zebrafish. About 500-bp PCR product: aberrant splicing of timmdc1 mRNA after being treated with MOs; 115-bp PCR product, wild-type splicing of timmdc1 mRNA in exons 2 and 3. Actin was used as an internal control. WT, wild-type zebrafish; Ctrl, zebrafish with injection of control-MOs; MO-0.25/0.5/0.75/1, zebrafish treated with different concentrations of MOs.
(F) Blue-native PAGE analysis of complex I in control (Ctrl) and timmdc1 KD (MO) zebrafish with anti-NDUFS3 antibodies. KD of timmdc1 in zebrafish was generated by treating the embryos with MOs for 3 days. VDAC was used as an internal control.
(G) The development of zebrafish embryos after injection of MOs was observed at 0, 24, 48, and 96 h. Thoracic cysts were observed in the timmdc1-MOs group. Ctrl, control zebrafish
(H) Touch response of control (Ctrl) and timmdc1 KD (MO) zebrafish at 48 hours post-fertilization (hpf; n = 24).
(I) Spontaneous movements of control (Ctrl) and timmdc1 KD (MO) zebrafish embryos at 19–24 hpf (n = 80).
(J and K) Blue-native PAGE (3%–11%) analysis of supercomplexes using digitonin-solubilized protein in immortalized lymphocytes derived from patient (P) and his asymptomatic mother (C). Antibodies against NDUFB6 (for CI), UQCRC2 (for CIII), MT-CO1 (for CIV), and TIMMDC1 were used for detection of supercomplexes (J). CI modules were analyzed by immunoblotting with antibodies against the N module:
NDUFS1 and NDUFS4 (J); Q module: NDUFS3 and NDUFA9 (J); PP-a module: NDUFA13 (J); PP-b module: NDUFC2 and NDUFA11 (K); PD-a module: NDUFB1, NDUFB6, and NDUFB11 (K); and PD-b module: NDUFB7, NDUFB8, and NDUFB9 (K). TOM70 was used as an internal control.
MO, morpholino oligonucleotides; quantitative data were generated from at least three independent experiments. Data are presented as the means ± SEM. ∗∗p < 0.01, ∗∗∗p < 0.001.