
Fig. 7
- ID
- ZDB-FIG-230224-10
- Publication
- Balamurugan et al., 2022 - PHLPP1 promotes neutral lipid accumulation through AMPK/ChREBP-dependent lipid uptake and fatty acid synthesis pathways
- Other Figures
- All Figure Page
- Back to All Figure Page
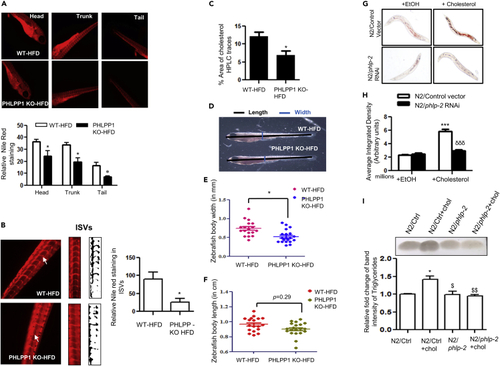
CRISPR-Cas9-mediated PHLPP1 knockout in HFD-fed zebrafish larvae and siRNA silencing of phlp-2 in C. elegans diminishes lipid accumulation (A and B) Fluorescent microscopic images of head, trunk, and tail (A) along with intersegmental blood vessels (ISVs; B) with quantification (A, Bottom panel and B, right panel). Each microscopic image represents three to four experiments with each experiment studying minimum of five larvae; Magnification: Head, trunk, and tail - |×4×|; Intersegmental blood vessels – 10X; Statistical analysis was performed using two-tailed t-test (∗p < 0.05 vs WT-HFD). (C) Cholesterol levels in PHLPP1-knockout HFD-fed zebrafish larvae measured by HPLC-based method. Each experimental data point indicates 20 pooled larvae; Statistical analysis was performed using two-tailed t-test (∗p < 0.05 vs WT-HFD). (D–F) Pictorial depiction along with linear body width (E) and whole-body length (F) measurement in PHLPP1-knockout zebrafish larvae; Statistical analysis was performed using two-tailed t-test (∗p < 0.05 vs WT-HFD). (G and H) Microscopic images (G) and quantification (H) of Oil Red O staining in cholesterol-fed phlp-2 knockdown C. elegans; data presented are from a representative experiment of two independent trials (n = 7–12 per trial); Statistical analysis was performed using one-way ANOVA followed by Bonferroni′s post hoc analysis (∗∗∗p < 0.001 vs N2/control+EtOH; δδδp < 0.001 vs N2/control+cholesterol). (I) TLC analysis of triglyceride levels in cholesterol-fed phlp-2 knockdown C. elegans along with ImageJ quantification (Bottom). Statistical analysis was performed using one-way ANOVA followed by Bonferroni′s post hoc analysis (∗p < 0.05 vs N2/Ctrl; $p < 0.05, $$p < 0.01 vs N2/Ctrl+chol). Data are a representative of at least three independent experiments, unless specified. Numerical data are expressed as mean ± SEM. See also Figure S6. |
| Fish: | |
|---|---|
| Condition: | |
| Observed In: | |
| Stage: | Days 7-13 |