
Fig. 4
- ID
- ZDB-FIG-230204-31
- Publication
- Brown et al., 2021 - A novel gene trap line for visualization and manipulation of erbb3b+ neural crest and glial cells in zebrafish
- Other Figures
- All Figure Page
- Back to All Figure Page
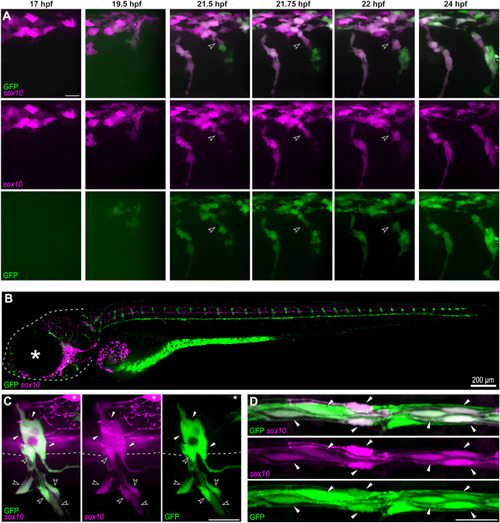
Fig. 4. erbb3b-driven transgene is co-expressed with sox10 in neural crest cells and a subset of glia (A) Images from an in vivo time-lapse movie of Tg(sox10:TagRFP);gSAIzGFFD37A embryos from 17 to 24 hpf. GFP expression is visible in trunk neural crest cells at 19.5 hpf. Neural crest delamination indicated by arrowheads. (B) Whole-mount, in vivo imaging of Tg(sox10:TagRFP);gSAIzGFFD37A larvae at 120 hpf (dashed line outlining head; star marking eye). (C) Confocal imaging of double-positive trunk neural crest-derived glia in the dorsal root ganglion such as satellite glia (white arrowheads) and peripheral glia (open arrowheads) including MEP glia and Schwann cells; TagRFP+/GFP− OL indicated by asterisk. (D) Other double-positive Schwann cells (arrowheads) along the posterior lateral line nerve. Scale bars, 20 μm unless otherwise noted. |
Reprinted from Developmental Biology, 482, Brown, E.A., Kawakami, K., Kucenas, S., A novel gene trap line for visualization and manipulation of erbb3b+ neural crest and glial cells in zebrafish, 114-123, Copyright (2021) with permission from Elsevier. Full text @ Dev. Biol.