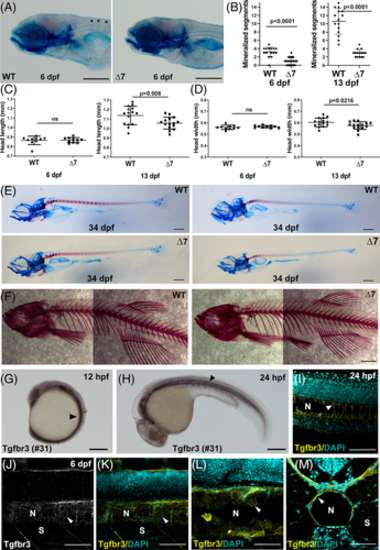
Tgfbr3 is expressed in the notochord and its absence results in chordacentra mineralization delay. A, WT (tgfbr3 +/+) and null ∆7 mutant (tgfbr3 ∆7/∆7) 6 dpf embryos were stained with alizarin red and alcian blue to label bone and cartilage. Asterisks mark notochord mineralized segments (red stripes). Mineralized segments (B), head length (C), and head width (D) were quantized in WT and ∆7 embryos at 6 and 13 dpf. Two-tailed Student's t-test was performed, and P values are shown. E, Bone and Cartilage staining of 34 dpf larvae. Two representative images of different length WT and Mutant larvae shows delayed mineralization in mutant larvae. F, Alizarin red staining of 1 year WT and ∆7 fishes showing normal skeletons. G-M, Tgfbr3 expression in the developing notochord. Whole mount IHC of 12 hpf (G) and 24 hpf (H) embryos reveal positive staining for Tgfbr3 in axial mesoderm and developing notochord, and in notochord, respectively (arrowheads). IF images of 24 hpf (L, cryosection) and 6 dpf (J and K, wholemount and L and M, cryosections) embryos revealed Tgfbr3 expression in the membranes of vacuolated notochordal inner cells and in the membranes of outer sheath cells (arrowheads). Somite (S), notochord (N), scale bar in A, F, G, and H: 200 μm, in E, I-M: 100 μm
|
