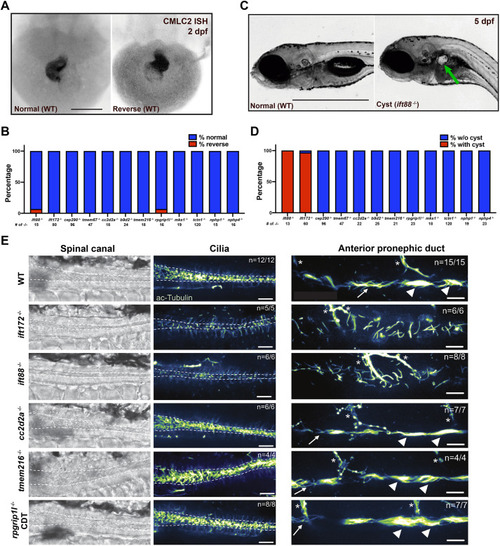
TZ mutants lack left–right heart looping or glomerular cyst, and have normal-appearing cilia. (A) Whole-mount in situ hybridization (ISH) against cmlc2 RNA in WT zebrafish embryos at 2 dpf with normal phenotype of heart looping (left) and reverse heart looping (right). Reverse example found in WT clutch. Scale bar: 25 μm. (B) Bar graph depicting the ratio of mutant embryos with normal heart looping (% normal, blue) and with reverse heart looping (% reverse, red) at 2 dpf. The total number of each mutant is indicated. (C) Gross images of lateral views of representative zebrafish embryos with cyst (right; imaging with ift88−/−) or without cysts (left; imaging with WT embryo). Green arrow indicates the pronephric cyst. Scale bar: 1000 μm. (D) Bar graph depicting the ratio of mutant embryos without cysts (% w/o cyst, blue) and with cysts (% with cyst, red) at 5 dpf. The total number of each mutant is indicated. (E) Immunostaining of cilia in spinal canal and anterior pronephric duct. Acetylated-Tubulin antibodies were used to detect cilia in the caudal end of the spinal canal near the tip of the tail and in the anterior pronephric duct at 2 dpf. Representative brightfield images of the spinal canal, and fluorescent images of the spinal canal and anterior pronephric duct (green fire blue LUT) are shown for WT, ift172−/−, ift88−/−, cc2d2a−/−, tmem216−/− and rpgrip1l−/− embryos. WT siblings were analyzed for each mutant. All mutant embryos analyzed had a CDT phenotype. Dashed lines outline approximate boundaries of the spinal canal. The anterior pronephric duct has a mixture of multi-ciliated tufts (arrowheads) and monocilia (arrows). Motor axons are also stained by acetylated-Tubulin antibodies (marked with asterisks). n=number of embryos with the depicted staining/total number of embryos analyzed. Scale bars: 25 µm.
|
