
Fig. 6
- ID
- ZDB-FIG-230118-33
- Publication
- Garoche et al., 2021 - Interspecies Differences in Activation of Peroxisome Proliferator-Activated Receptor γ by Pharmaceutical and Environmental Chemicals
- Other Figures
- All Figure Page
- Back to All Figure Page
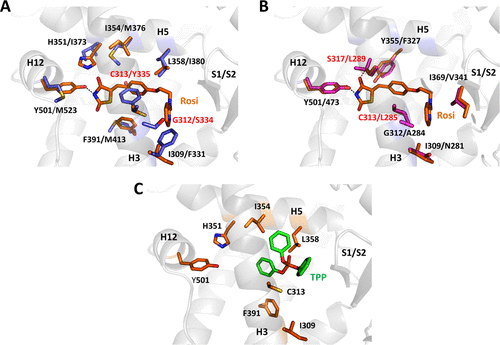
Figure 6. Structural basis for differential ligand-binding specificities of h, x, and zfPPARγ. (A) Rosiglitazone is positioned in the ligand-binding pocket of hPPARγ (crystal structure PDB code 2PRG). Residues that differ in the ligand-binding pockets of hPPARγ (orange) and zfPPARγ (blue) are displayed and labeled. The zebrafish receptor was modeled using the server EDMon (http://edmon.cbs.cnrs.fr). hPPARγ G312 and C313, which are replaced by serine and tyrosine residues, respectively, in the zebrafish receptor, are highlighted with red labels. (B) Superposition of the crystal structure of hPPARγ (2PRG) bound to rosiglitazone and a model of xPPARγ generated by the server EDMon. Residues that differ in the ligand-binding pockets of hPPARγ (orange) and xPPARγ (magenta) are displayed and labeled (except the tyrosine residue in helix H12, which is conserved in both species). hPPARγ C313 and S317, which are replaced by leucine residues in the xenopus receptor, are highlighted with red labels. (C) TPP as modeled in the ligand-binding pocket of hPPARγ. |