
Fig. 6
- ID
- ZDB-FIG-230115-63
- Publication
- Brandt et al., 2021 - Ablation of mpeg+ Macrophages Exacerbates mfrp-Related Hyperopia
- Other Figures
- All Figure Page
- Back to All Figure Page
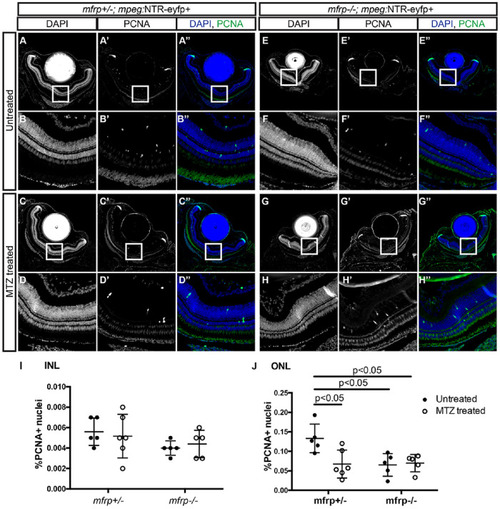
Proliferative effects of mfrp deletion and macrophage ablation. (A–H) Representative images of central retina sections from mfrp+/–; mpeg1:NTR-eYFP+ and mfrp–/–; mpeg1:NTR-eYFP+ MTZ treated and untreated fish. (A–H) Grayscale DAPI images at low magnification (A, C, E, G) and high magnification (B, D, F, H). (A'–H') Grayscale PCNA images at low magnification (A', C', E', G') and high magnification (B', D', F', H'). (A''–H'') Colorized merged images with DAPI in blue and PCNA in green; images are at low magnification (A'', C'', E'', G'') and high magnification (B'', D'', F'', H''). (I–J) Quantification of the percentage of PCNA+ nuclei in the inner (I) and outer (J) nuclear layer. Error bars represent standard deviations. Two-way ANOVA was used for statistical analysis for (I) and (J). P values are shown from Tukey's multiple comparisons for post hoc analysis. For mfrp+/– untreated, n = 5; for mfrp+/– MTZ treated, n = 6; for mfrp–/– untreated, n = 5; for mfrp–/– MTZ treated, n = 5. |
| Fish: | |
|---|---|
| Condition: | |
| Observed In: | |
| Stage: | Days 45-89 |