
Fig. 5
- ID
- ZDB-FIG-221226-35
- Publication
- Tanimoto et al., 2022 - Tiltable objective microscope visualizes selectivity for head motion direction and dynamics in zebrafish vestibular system
- Other Figures
- All Figure Page
- Back to All Figure Page
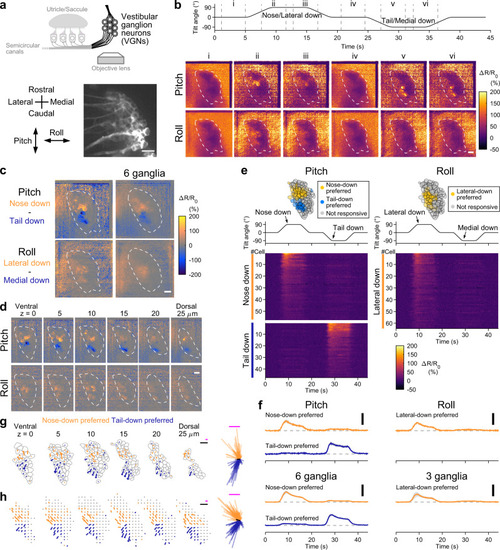
Topographic representation of head tilt direction in VGNs.
a Imaging of VGNs (top). VGNs in the rostral division of VG in a 5 dpf Tg(myo6b:jGCaMP7f; myo6b:tdTomato) larva imaged from ventral (bottom). Red channel is shown. Scale bar: 10 μm. The same orientation applies to (b)–(e), (g), and (h). b VGN responses to 90° static tilt (see Supplementary Movie 5). Tilt time course (top). Sequential images showing mean ΔR/R0 responses during the time period “i” to “vi” (bottom). Maximum intensity projection of six optical slices with 5 μm intervals. Single trial at each slice. Dashed lines: VG contours. Scale bar: 10 μm. The same ganglion is shown in (c), (d), (e), and (g). Response selectivity for tilt direction in images of maximum intensity projection (c) and different depth (d). Tail-down response (“v” in [b]) subtracted from nose-down response (“ii” in [b]) (top). Medial-down response (“v” in [b]) subtracted from lateral-down response (“ii” in [b]) (bottom). Dashed lines: VG contours. Scale bar: 10 μm. Average of 6 ganglia ([c], right). e Tilt responses per VGN. VGN location (top, 6 optical slices overlaid). Tilt time course (middle). ΔR/R0 responses (bottom). f Mean ΔR/R0 responses across VGNs in each preference group in a single VG (top). Number of cells is reported in the Supplementary Fig. 4 legend. Mean responses of each group (bottom, 6 VG for pitch; 3 left VG for roll; 3 right VG are shown in Supplementary Fig. 4e). SEM is shown in gray. Tilt time course is the same as in (e). Scale bar: 50% ΔR/R0. g VGN response vectors. Orientation and length of arrows indicate preferred direction and ΔR/R0 amplitude, respectively. Responses with amplitude larger than 10% ΔR/R0 are shown. Gray: VGN contours. Magenta scale bar: 50% ΔR/R0. Black scale bar: 10 μm. (right-end panel) All response vectors aligned together. Black bar: mean response vector. Magenta scale bar: 50% ΔR/R0. h Summary of VGN response vectors from 6 ganglia. Mean response vectors per grid (see “Methods”). Arrows and gray dots show mean response vectors with amplitude larger or not larger than 10% ΔR/R0, respectively. Colors and scale bars are the same as in (g). Source data are provided as a Source Data file. |