|
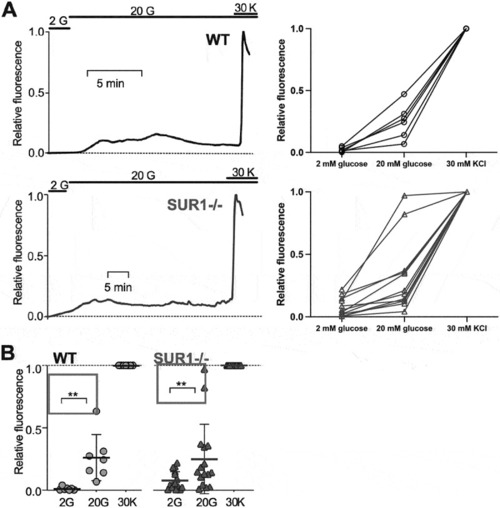
SUR1−/− islets exhibit elevated basal [Ca2+] and reduced responsivity to glucose (a) Representative recordings of intracellular calcium in the presence of 2 mM glucose (2 G) and following switch to 20 mM glucose (20 G) and then 30 mM KCl (30 K), for WT (above, n = 6) and SUR1−/− (below, n = 12). Fluorescence is normalized to maximum fluorescence in 30 K (f = 1), and minimum fluorescence (f = 0) anywhere within the record. Values for each islet are also shown. (b) Average calcium in each condition for WT (N = 8) and SUR1−/− (n = 14). Data in B are analyzed by 1-way ANOVA followed by multiple unpaired t-tests. (*) p < .05, (**) p < .01.
|