
Fig. 6
- ID
- ZDB-FIG-221211-210
- Publication
- Zadra et al., 2022 - Chromosome segregation fidelity requires microtubule polyglutamylation by the cancer downregulated enzyme TTLL11
- Other Figures
- All Figure Page
- Back to All Figure Page
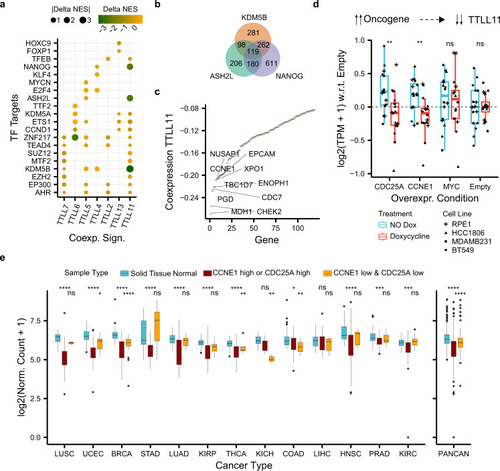
a Differences in normalized enrichment scores (NES) (Delta NES) between the tumor and healthy co-expression signatures (x axis) of each TTLL glutamylase enzyme correlated against the rest of the genes. NES were obtained through gene-set enrichment analysis (GSEA) and show whether a co-expression profile is significantly enriched (FDR < 0.05) in genes targeted by a transcription factor (y axis) from the ChIP-seq-based ChEA dataset24). b Overlap between enriched transcription factor targets coexpressing with TTLL11 in tumors. c Co-expression (y axis) between TTLL11 and enriched 119 transcription factor targets of KDM5B, ASH2L, and NANOG in tumors (x axis). d Normalized gene expression of TTLL11 with respect to the control (“Empty”) condition (y axis) upon overexpression with doxycycline (“Treatment” color) of different oncogenes (x-axis) across four different cell models (“Cell Line” dot shape). Each condition and treatment contain N = 16 biologically independent experiments (four for each cancer cell line). In each box plot, the median value is indicated as a horizontal line and the lower and upper bounds of the box correspond to the first and third quartiles, respectively. The upper and lower whiskers range from the corresponding box hinges to the largest value no further than 1.5 times the interquartile range from the hinge. All outlying data points beyond the whiskers are plotted individually. e Normalized expression of TTLL11 (y axis) in healthy solid tissues and the corresponding primary tumor samples stratified by the expression of CCNE1 and CDC25A (“Sample Type” color) across 13 different cancer types (x axis), separately and combined (PANCAN). Statistical tests compare healthy solid tissues against either samples with high expression of CCNE1 or CDC25A (“CCNE1_high or CDC25_high”) or samples with low expression of both upstream regulators of TTLL11 (“CCNE1_low & CDC25A_low”). Number of samples per cancer type and sample type (see Supplementary Table 5) In each box plot, the median value is indicated as a horizontal line and the lower- and upper bounds of the box correspond to the first- and third quartiles, respectively. The upper and lower whiskers range from the corresponding box hinges to the largest value no further than 1.5 times the interquartile range from the hinge. All outlying data points beyond the whiskers are plotted individually. In all the figure, nominal P values: ****≤0.0001, ***≤0.001, **≤0.01, *≤0.05, based on unmatched two-sided Wilcox rank-sum tests. |