|
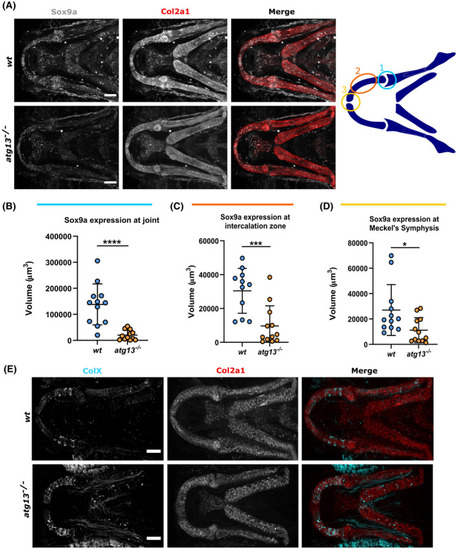
atg13 mutation affects expression and production of key factors in cartilage development. (A) Left, confocal max projections of lower jaw at 5 dpf in wt and atg13‐mutant fish, immunostained for Sox9a (grey) and Col2a1 (red). Scale bars = 50 µm. Right, schematic showing regions of interest selected within lower jaw in modular image analysis program (SoxQuant). Colours correspond to graphs below. (B–D) Quantification of Sox9a expression measured as volume of Sox9a within Col2a1 positive cells from confocal z‐stack. Student's unpaired t test performed where ****p < .0001, ***p = .0007, *p = .0173; n = 12 for both. (E) Confocal max projections of the lower jaw at 7 dpf in Tg(atg13; Col2a1aBAC:mcherry) wt and atg13‐mutant larvae, immunostained for collagen Type X (ColX) (cyan) and mCherry (for Col2a1, red). Scale bars = 50 µm
|