
Fig. 2
- ID
- ZDB-FIG-221118-204
- Publication
- Levic et al., 2021 - Knock-in tagging in zebrafish facilitated by insertion into non-coding regions
- Other Figures
- All Figure Page
- Back to All Figure Page
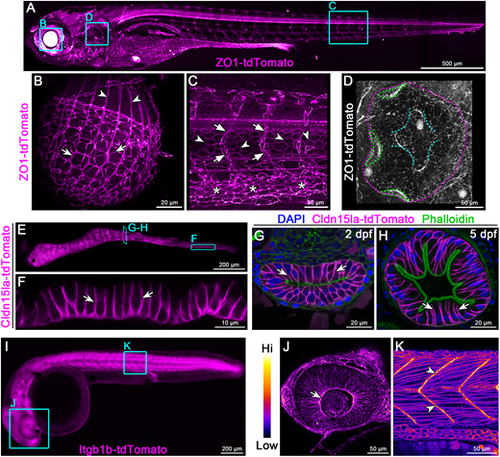
Endogenous C-terminal tagging of ZO-1, Cldn15la and Integrin β1b. (A-D) Live 3D reconstructions of TgKI(tjp1a-tdTomato)pd1224 heterozygous larvae. B: arrows, lens epithelial cells; arrowheads, lens fiber cells. C: arrows, intersegmental vessels; arrowheads, notochord sheath cells; asterisks, caudal vein plexus. D: magenta dotted line, otic capsule; green dotted lines, cristae; cyan dotted lines, canals and septum. Animals are 7 dpf (A), 5 dpf (B) and 3 dpf (C,D). (E,F) Live imaging of the intestine of a 7 dpf TgKI(cldn15la-tdTomato)pd1249 heterozygous larva. Arrows, intestinal epithelial cell (IEC) basolateral membrane. (G,H) Transverse sections of the intestine at stages of lumen opening (2 dpf) (G) and onset of larval feeding (5 dpf) (H). Arrows, IEC basolateral membrane. (I-K) Live imaging of a 28 hpf TgKI(itgb1b-tdTomato)sk108 heterozygous embryo. J and K are pseudo-colored according to the look-up table (LUT) scale shown. J: arrow, optic cup basolateral membrane. K: arrowheads, myotendinous junctions. Cyan boxes are representative regions of interest panels indicated. Scale bars: 500 µm (A); 20 µm (B,G,H); 50 µm (C,D,J,K); 200 µm (E,I); 10 µm (F). |