
Fig. 4
- ID
- ZDB-FIG-221023-10
- Publication
- Rupprecht et al., 2021 - A database and deep learning toolbox for noise-optimized, generalized spike inference from calcium imaging
- Other Figures
- All Figure Page
- Back to All Figure Page
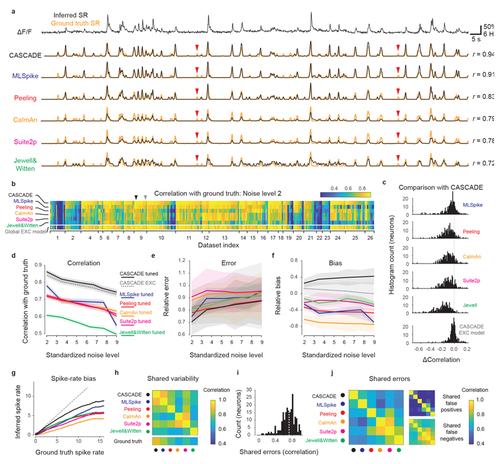
Comparison with model-based algorithms.
a, Example calcium imaging recording and corresponding predictions from the deep-learning based method (CASCADE) and five model-based algorithms (MLSpike, Peeling, CaImAn, Suite2p, Jewell&Witten). Respective predictions are in black, ground truth in orange. r indicates correlation of predictions with ground truth. Clear false negative detections are labeled with red arrowheads. b, Heat map of the performance (correlation) of each algorithm for each dataset and neuron, calculated at standardized noise level 2 % Hz −1/2. All algorithms, except for CASCADE’s global EXC model (cf. Fig. 3), were tuned to the respective dataset by the mean squared error between ground truth and inferred spike rate. Arrowheads highlight the example neurons shown in Fig. 4a (black) and Extended Data Fig. 7 (grey). c, Direct comparison of performance (b) between CASCADE and other algorithms on a single-neuron basis. The difference in performance (correlation) is shown as a histogram across all neurons. ‘Global EXC model’ as defined in Fig. 3. d-f, Comparison of correlation, error and bias across all algorithms and noise levels. v in units of standardized noise, % · Hz−1/2. Solid/dashed lines indicate the mean across all neurons, shaded areas represent the SEM. g, Spiking activity in 2 s-bins, ground truth vs. Predictions. Lines indicate medians across distributions. Algorithms are color-coded as before. Underlying distributions are shown in Fig. S10. The unity relationship is shown as dashed line. h, Variability shared across algorithms, measured by the correlation between predictions. i, Histogram of error shared between CASCADE and MLSpike, quantified as the correlation between the unexplained variances for each neuron. Dashed line indicates the median. j, Shared median errors as illustrated in (i) for all pairs of algorithms. The smaller matrices to the right break the shared errors down into false positives and false negatives. All quantifications were performed with ground truth datasets resampled at 7.5 Hz with a noise level of 2 unless otherwise indicated. Dataset #03 was omitted for all comparisons in Fig. 4 since the short recordings (<10 s) could not be processed by all algorithms. |