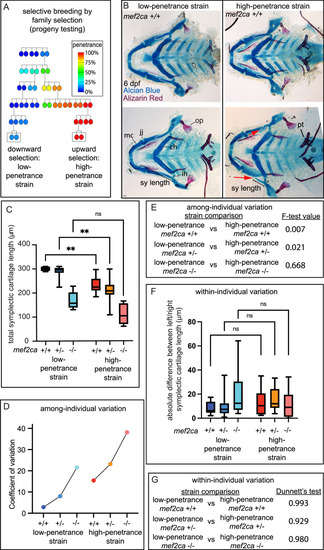
(A) Selective breeding pedigree illustrating ectopic bone phenotype penetrance inheritance. Dashed boxes indicate families used in this study. Six generations of full-sibling inbreeding produced the animals used here, a more complete pedigree extending back >10 generations can be found in our previous publication (Sucharov et al., 2019). (B) Alcian blue- and Alizarin red-stained animals from the low- and high-penetrance strains were genotyped, and mef2ca homozygous wild types were flat mounted and imaged. The following craniofacial skeletal elements are indicated in a wild-type individual from the low-penetrance strain: opercle bone (op), Meckel’s (mc), ceratohyal (ch), symplectic (sy) cartilages, interhyal (ih), and jaw (jj) joints. Phenotypes normally associated with mef2ca homozygous mutants are present in some wild types from the low-penetrance strain including: ih joint fusions (^) and shortened sy (red arrows). Bars indicating sy length are presented to illustrate the shortened symplectic phenotype present in some high-penetrance wild types but not low-penetrance wild types. A stage-appropriate complement of ankylosed of pharyngeal teeth (pt) are present, and normal sized op bones are present in the individual with shortened sy, indicating the phenotypes we discovered in high-penetrance mef2ca+/+ are not due to general delay. Dashed outline indicates symplectic cartilage. Scale bar: 50 μm (C) Symplectic cartilage length was measured from 6 days post fertilization (dpf) larvae from wild types, heterozygotes, and homozygous mutants from both the low- and high-penetrance strains. p-Values from a Dunnet’s T3 test are indicated (**≤0.01). (D) The coefficient of variation for symplectic length in all three genotypes from both strains was plotted (E) Table listing F-test values testing for significant differences in variation between strains comparing the same genotype. (F) Symplectic cartilage length on left and right sides of 6 dpf zebrafish was measured to determine fluctuating asymmetry or the absolute difference between left and right for all three genotypes from both strains. (G) Table listing the Dunnett’s test for significant differences in fluctuating asymmetry between all three genotypes from both strains. For box and whisker plots, the box extends from the 25th to 75th percentiles. The line in the middle of the box is plotted at the median, and the bars are minimum and maximum values.