
FIGURE
Fig. 2
- ID
- ZDB-FIG-221017-23
- Publication
- Pandey et al., 2021 - Multiplexed bio-imaging using cadmium telluride quantum dots synthesized by mathematically derived process parameters in a continuous flow active microreactor
- Other Figures
- All Figure Page
- Back to All Figure Page
Fig. 2
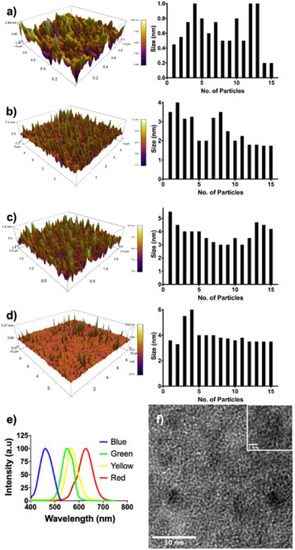
Fig. 2. AFM 3D topographic images and size distribution graph different sized QDs of a) 0.5 nm; b) 3.32 nm; c) 3.34 nm; and d) 3.92 nm; e) Photoluminescence spectra of all the QDs; f) TEM of green-colored CdTe nanoparticles are seen in a size range of 3–5 nm (atomic planes are visible in the inset image). |
Expression Data
Expression Detail
Antibody Labeling
Phenotype Data
Phenotype Detail
Acknowledgments
This image is the copyrighted work of the attributed author or publisher, and
ZFIN has permission only to display this image to its users.
Additional permissions should be obtained from the applicable author or publisher of the image.
Full text @ Mater Today Bio