
Fig. 4
- ID
- ZDB-FIG-220921-4
- Publication
- Chu et al., 2022 - In vivo drug discovery for increasing incretin-expressing cells identifies DYRK inhibitors that reinforce the enteroendocrine system
- Other Figures
- All Figure Page
- Back to All Figure Page
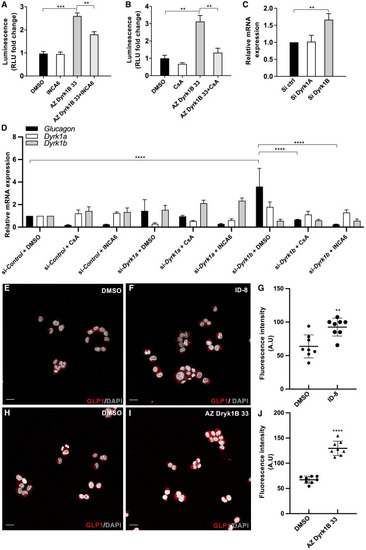
Figure 4. Inhibition of Dyrk1b, but not Dyrk1a, promotes Glucagon/GLP-1 expression in a mouse enteroendocrine cell line (A and B) AZ Dyrk1B 33 stimulates Tg(gip:Nluc) activity and acts via NFAT-calcineurin signaling. The effect of AZ Dyrk1B 33 (1 μM) on increasing the luminescence activity in Tg(gip:Nluc) transgenics can be inhibited by either 2 μM cyclosporine A (CsA) (A) or 10 μM NFAT-calcineurin association-6 (INCA6) (B). n = 4 wells per group. ∗∗∗p < 0.001. ∗∗p < 0.01. (C) Quantification of Glucagon expression in GLUTag cells with qPCR, after genetic silencing using control small interfering RNA (siRNA) and siRNA targeting Dyrk1a or Dyrk1b. n = 6 per group. ∗∗p < 0.01. (D) Glucagon expression in GLUTag cells assessed with qPCR upon control, Dyrk1a or Dyrk1b knock-down could be reversed by either calcineurin inhibitor, i.e. CsA or INCA6. n = 3 per group. ∗∗∗∗p < 0.0001. (E–J) GLP-1 expression in GLUTag cells is stimulated after treatment with DYRK inhibitors. Representative confocal images of GLUTag cells stained for GLP-1 (red) and DAPI (grey) after treatment with DMSO (E, H), ID-8 (F), or AZ Dyrk1b 33 (I). Scale bars, 20 μm. Quantification of GLP-1 staining intensity per cell after treatment with ID-8 (G) or AZ Dyrk1b 33 (J) for 24 h n = 8 per group. ∗∗p < 0.01, ∗∗∗∗p < 0.0001. |