
Figure 6
- ID
- ZDB-FIG-220912-48
- Publication
- Routledge et al., 2022 - The scaffolding protein Flot2 promotes cytoneme-based transport of Wnt3 in gastric cancer
- Other Figures
- All Figure Page
- Back to All Figure Page
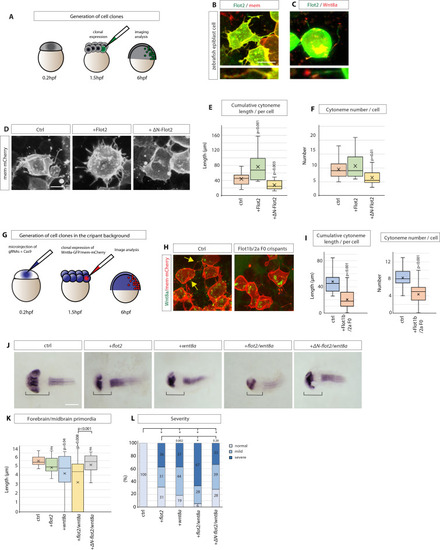
(A) Experimental setting to generate small clones expressing indicated constructs in the zebrafish embryo. (B, C) Confocal images of zebrafish epiblast cells injected with Flot2-GFP / memCherry and Flot2-GFP / Wnt8a-mCherry and imaged at 8 hpf. Scale bars represent 10 µm (D) Representative images of zebrafish epiblast cells injected with memCherry indicated constructs. Scale bar 10 µm. (E), (F), Quantification of filopodia from epiblast cells injected. Significance is calculated by Student’s t-test. (n per condition = 17, 20, and 14). (G), Experimental strategy to generate Wnt8a-GFP/mCherry cell clones in F0 Flot1b/2 a Crispants background. (H), Confocal images of zebrafish epiblast cells expressing indicated constructs. (I) Quantification of cytoneme length and number in injected epiblast cells. Significance is calculated by Student’s t-test. (n per condition = 18, 15) (J) In situ hybridisation against pax6a in zebrafish embryos at 30hpf after microinjection of 100 ng/µl of indicated DNA constructs and imaged. Scale bar represents 100 µm. (K) Quantification of forebrain and midbrain primordia length in zebrafish embryos injected as in (A). Significance is calculated by Student’s t-test. (n per condition = 23, 16, 27, 18, and 18; n=number of embryos). (L) Qualitative analysis of phenotype severity in zebrafish embryos injected as indicated in (A). Phenotypes are classified into the categories normal, mild and severe. Numbers in bars represent percentages of total embryos. A Pearson’s χ2 test revealed a significant difference between the ctrl group (expected) and experimental groups (observed) with 2 degrees of freedom (df) and a p-value < 0.05 of χ2 <0.001. Distribution comparison of flot2 injected embryos revealed a significant difference to the wnt8a group (χ2=0.002) and the flot2 + wnt8 a group (χ2<0.001), but not to wnt8a+ΔN-flot2 (χ2=0.28). Asterisks mark significant differences.
|