
Fig. 3
- ID
- ZDB-FIG-220909-20
- Publication
- Luo et al., 2022 - Identification and functional characterization of BICD2 as a candidate disease gene in an consanguineous family with dilated cardiomyopathy
- Other Figures
- All Figure Page
- Back to All Figure Page
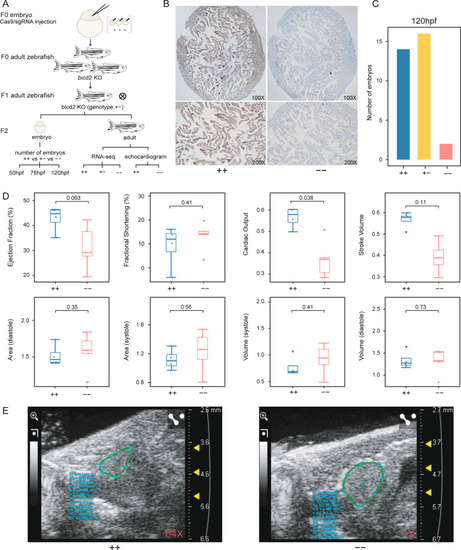
DCM-associated phenotypes in bicd2-deficient zebrafish. A. Flow chart of bicd2 zebrafish model development for functional experiments. B. Immunohistochemistry of zebrafish hearts with anti-BICD2 antibody showing the absence of staining in bicd2–fish and ubiquitous staining in wild-type fish. C. Number of homozygous (n = 2), heterozygous (n = 16) and wild-type (n = 14) embryos at 120 hdf. D. Boxplot showing indices of ventricular size, including area, volume, ejection fraction, fractional shortening, cardiac output, and stroke volume, in homozygotes (n = 5) and wild-type fish (n = 4). The lower and upper hinges correspond to the 25th and 75th quartiles. The upper whisker extends from the upper hinge to the largest value no further than 1.5 × IQR from the hinge; The lower whisker extends from the hinge to the smallest value at most 1.5 × IQR of the hinge. Data beyond the end of the whiskers are "outlying" points and are plotted individually. IQR(the inter-quartile range): distance between the first and third quartiles. E. Echocardiogram plot showing ejection fraction difference between a homozygous mutant and a wild-type fish |
| Fish: | |
|---|---|
| Observed In: | |
| Stage Range: | Day 5 to Adult |