
Fig. 4
- ID
- ZDB-FIG-220906-22
- Publication
- Zhang et al., 2022 - Identification of Scd5 as a functional regulator of visceral fat deposition and distribution
- Other Figures
- All Figure Page
- Back to All Figure Page
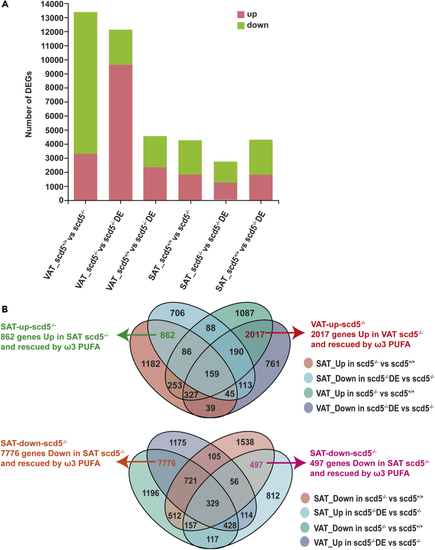
Transcriptome analysis of VAT of scd5−/− and scd5−/− DE (A) Histogram of number of DEGs obtained from the comparative analysis between the six samples. Pink square indicates upregulated, green square indicates downregulated (n = 2). (B) Venn analysis of DEGs. Each elliptical box represents different gene groups. Four genes sets were obtained by intersection. VAT-up-scd5−/− (2017 genes which were upregulated in VAT sample of scd5−/− compared to scd5+/+, restored in VAT sample of scd5−/− DE, and not significantly different in SAT samples of all three strains) , VAT-down-scd5−/− (7,776 genes which were downregulated in the VAT of scd5−/− compared to scd5+/+, restored in the VAT of scd5−/− DE, and have no significantly difference in the SAT of scd5−/− and scd5−/− DE), SAT-up-scd5−/− (862 genes which were upregulated in the SAT of scd5−/− compared to scd5+/+ and restored in the SAT of scd5−/− DE, and have no significantly difference in the VAT of all three strains), and SAT-down-scd5−/− (497 genes which were downregulated in the SAT of scd5−/− compared to scd5+/+, restored in the SAT of scd5−/− DE, and have no significantly difference in the VAT of scd5−/− and scd5−/− DE). |