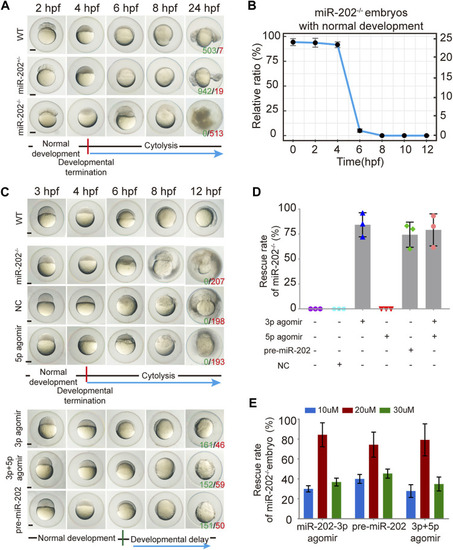
Deletion of the miR-202 locus recapitulated the phenotype of miR-202-3p knockdown. (A) Time-matched bright field images showing developmental termination of homozygous (miR-202−/−) embryos at 4 hpf in contrast with normal development of heterozygous (miR-202+/-) and wild type (WT) embryos. The green number indicates the number of embryo with normal development and in red the number indicates the abnormal development. WT embryos at 24 hpf were used as phenotypic control. (B) The survival rate curve for miR-202−/− embryos from 0 to 12 hpf. (C) Time-matched bright field images of miR-202−/− embryos when rescued by various reagents. The green number indicates the number of embryo that has been rescued and in red the number indicates the unsalvaged. 3p agomir embryos at 12 hpf were used as the control of successful rescue phenotype. (D) Rescue rates of miR-202−/− homozygotes by miR-202-3p agomir, miR-202-5p agomir, pre-miR-202 and a combination of miR-202-3p and miR-202-5p agomirs measured at 12 hpf. (E) The rescue rates of miR-202−/− embryos obtained with three different concentrations (10 μM, 20 and 30 µM) of rescue reagents measured at 12 hpf, indicating an optimal rescuing concentration for each reagent. The scale bar is 200 µm. Error bars, mean ± s.d., n = 3 (biological replicates).
|
