
FIGURE
Fig. 4
- ID
- ZDB-FIG-220819-55
- Publication
- Wang et al., 2021 - Transcriptome analysis of the early stage ifnlr1-mutant zebrafish indicates the immune response to auditory dysfunction
- Other Figures
- All Figure Page
- Back to All Figure Page
Fig. 4
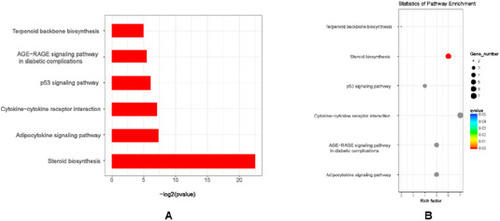
Fig. 4. KEGG enrichment significant bar chart and KEGG enrichment significant scatter. (A) KEGG enrichment significant bar: Significantly enriched KEGG pathways based on p ≤ 0.05, horizontal axis means logarithm of p value, vertical axis means the KEGG pathway items. (B) KEGG enrichment significant scatter: Each dot represents a KEGG pathway, the names of pathways are seen in vertical axis and enrichment factors are seen in horizontal axis. The larger the enrichment factor, the more reliable the significant enrichment of the DEGs in this pathway. |
Expression Data
Expression Detail
Antibody Labeling
Phenotype Data
Phenotype Detail
Acknowledgments
This image is the copyrighted work of the attributed author or publisher, and
ZFIN has permission only to display this image to its users.
Additional permissions should be obtained from the applicable author or publisher of the image.
Reprinted from Gene expression patterns : GEP, 43, Wang, W.Q., Qiu, S.W., Huang, S.S., Wang, G.J., Han, M.Y., Kang, D.Y., Yuan, Y.Y., Gao, X., Dai, P., Transcriptome analysis of the early stage ifnlr1-mutant zebrafish indicates the immune response to auditory dysfunction, 119229, Copyright (2021) with permission from Elsevier. Full text @ Gene Expr. Patterns