FIGURE

Figure 4

ID
ZDB-FIG-220816-59
Publication
Zeng et al., 2022 - Sexual dimorphic effects of igf1 deficiency on metabolism in zebrafish
Other Figures
All Figure Page
Back to All Figure Page
Figure 4

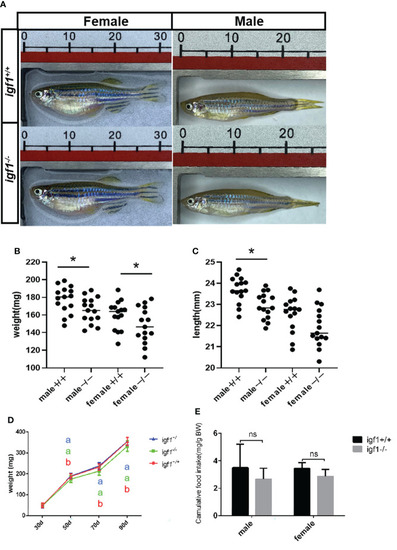
General growth performance traits of igf1-deficient fish. (A) Appearance of igf1-deficient fish and their control wild-type fish at 90 dpf (n=15/group). (B, C) Body weight of the fish at the 90-dpf stage. Three times of independent growth analysis were carried out and showed similar results. *P < 0.05. (D) Growth curves of wild type, heterozygous and igf1-deficient zebrafish during the growth statge. (E) The food intake data was showed in the chart. 10 animals were weighted for each experiment and three biological repeats were carried out and statistical analysis was performed using a t test (ns, p>0.05, n=3). The letters a and b in the charts represent significant differences between which labeled with different letters.

Expression Data

Expression Detail
Antibody Labeling
Phenotype Data
Fish:
Observed In:
Stage Range: Days 30-44 to Adult

Phenotype Detail
Acknowledgments
This image is the copyrighted work of the attributed author or publisher, and ZFIN has permission only to display this image to its users. Additional permissions should be obtained from the applicable author or publisher of the image. Full text @ Front Endocrinol (Lausanne)