
FIGURE
Fig. 2
- ID
- ZDB-FIG-220808-54
- Publication
- Ricci et al., 2022 - Power-effective scanning with AODs for 3D optogenic applications
- Other Figures
- All Figure Page
- Back to All Figure Page
Fig. 2
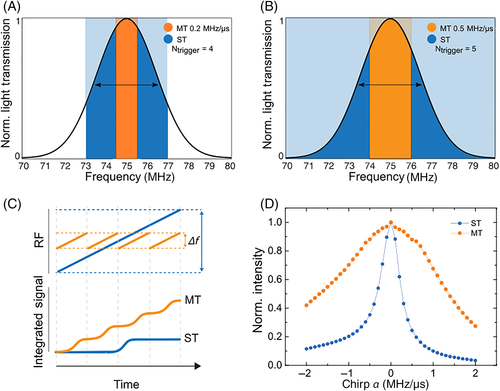
A,B. Transmission efficiency of the second stage as a function of the acoustic frequency driving the AOD. The bandwidths addressed in the ST and MT modes are colored in blue and orange, respectively. A, Low chirp case: α = 0.2 MHz/μs. B, High chirp case: α = 0.5 MHz/μs. The number of triggers is indicated for the MT modality. C, Top: Schematic of the RF signals used to drive each AOD in the ST (blue) and MT (orange) modes. After the chirp α is defined, a frequency ramp is generated once (single trigger) or repeated multiple times (multitrigger) within the dwell time window. Bottom: The simulated integrated signal collected by the PMT. D, Normalized fluorescence signal collected by the PMT as a function of the applied chirp, addressing light in separate planes with ST (blue) and MT (orange) configurations; 2D raster scans are obtained by illuminating 10 × 10 points with a dwell time of 20 μs. The integration time of the PMT was set consistently to 20 μs. AOD, Acousto-optic deflector; MT, multitrigger; ST, single trigger
|
Expression Data
Expression Detail
Antibody Labeling
Phenotype Data
Phenotype Detail
Acknowledgments
This image is the copyrighted work of the attributed author or publisher, and
ZFIN has permission only to display this image to its users.
Additional permissions should be obtained from the applicable author or publisher of the image.
Full text @ J. Biophotonics