
FIGURE
Fig. 6
- ID
- ZDB-FIG-220714-22
- Publication
- Banerjee et al., 2022 - Molecular and Cellular Analysis of the Repair of Zebrafish Optic Tectum Meninges Following Laser Injury
- Other Figures
- All Figure Page
- Back to All Figure Page
Fig. 6
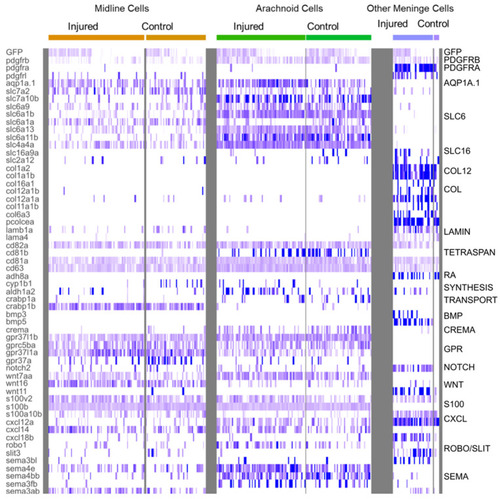
Heatmap of characteristic gene expression levels in MID, ARA and OMN cells from control and injured datasets. Each column represents a cell. Level of expression is encoded by color gradient. Strong expression is in dark blue and no expression is in white. Gene families are represented to the right of the panel in regards to the corresponding DEGs. |
Expression Data
Expression Detail
Antibody Labeling
Phenotype Data
Phenotype Detail
Acknowledgments
This image is the copyrighted work of the attributed author or publisher, and
ZFIN has permission only to display this image to its users.
Additional permissions should be obtained from the applicable author or publisher of the image.
Full text @ Cells