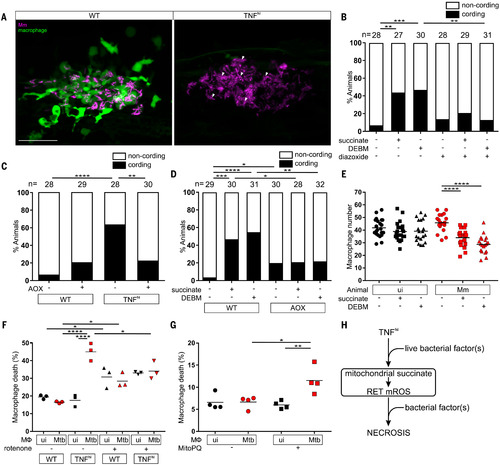
Fig. 6. TNF-mediated increased glutamine cellular uptake in mycobacterium-infected macrophages increases succinate oxidation, mROS, and necrosis. (A) Representative pseudocolored confocal images of 5-dpi granulomas in wild-type or TNFhi larvae with YFP-expressing macrophages (green) infected with tdTomato-expressing Mm (magenta). Arrowheads, extracellular cording bacteria. Scale bar, 50 μm. (B) Bacterial cording in wild-type larvae 5 days after infection with Mm, treated with vehicle, or succinate or DEBM alone or in combination with diazoxide; **P < 0.01, ***P < 0.001 (Fisher’s exact test). (C) Bacterial cording 5 days after infection with Mm in wild-type and TNFhi larvae and wild-type and TNFhi larvae expressing AOX; **P < 0.01, ****P < 0.0001 (Fisher’s exact test). (D) Bacterial cording 5 days after infection with wild-type or AOX-expressing larvae infected with Mm and treated with succinate, DEBM, or vehicle; *P < 0.05, **P < 0.01, ***P < 0.001, ****P < 0.0001 (Fisher’s exact test). (E) Number of trunk macrophages in Mm-infected larvae and mock-injected (ui) larvae 1 day after infection. Horizontal bars denote means; ****P < 0.0001 (one-way ANOVA with Dunn’s post-test). (F and G) Percentage of dead THP-1 macrophages 5 hours after addition of TNF, treated with rotenone or vehicle starting 1 hour before TNF addition (F) or MitoParaquat (MitoPQ) or vehicle for 5 hours (G). Black and red symbols represent uninfected (ui) and Mtb-infected macrophages, respectively, within the same treatment well. Horizontal bars denote means; *P < 0.05, **P < 0.01, ****P < 0.0001 (one-way ANOVA with Tukey’s post-test). (H) Schematic diagram showing the role of TNF, mROS, and mycobacterial factor(s) in TNF-mediated necrosis of mycobacterium-infected macrophages. Data are representative of two independent experiments [(C), (D), (E), and (G)] or a single experiment [(B) and (F)].
|
