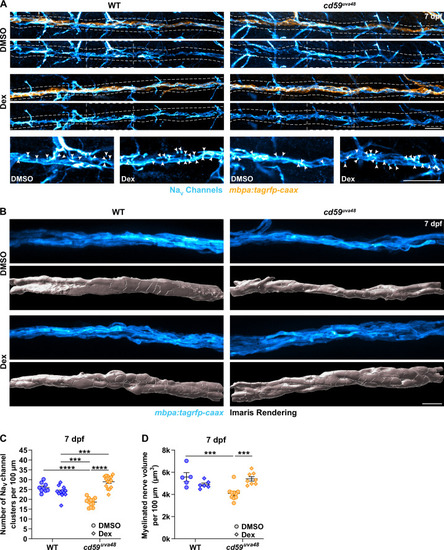
(A) Immunofluorescence (IF) showing NaV channels (cyan) along mbpa:tagrfp-caax-positive nerves (orange) at 7 days post fertilization (dpf) in larvae treated with DMSO or 100 µM dexamethasone (Dex). Diffuse NaV channel staining along unmyelinated nerves was not quantified. White dashed lines outline the posterior lateral line nerve (pLLN). White dashed boxes correspond with the insets below. Representative images are from somite 11–13 (~320 µm). (B) In vivo imaging showing the volume of mbpa:tagrfp-caax-positive nerves at 7 dpf in larvae treated with DMSO or 100 µM Dex. Bottom panels depict Imaris renderings (white) of myelinated nerve volumes. Representative images are from somite 12 (~110 µm). (C) Scatter plot of the number of NaV channel clusters along mbpa:tagrfp-caax-positive nerves at 7 dpf (mean ± SEM: DMSO: WT: 26.0 ± 0.8, cd59uva48: 18.6 ± 0.6; Dex: WT: 23.9 ± 0.8, cd59uva48: 28.9 ± 0.8; p-values: WT DMSO vs. cd59uva48 DMSO: p<0.0001, WT Dex vs. cd59uva48 DMSO: p=0.0001, WT Dex vs. cd59uva48 Dex: p=0.0001, cd59uva48 DMSO vs. cd59uva48 Dex: p<0.0001; dot = 1 fish). These data were compared with a two-way ANOVA with Tukey’s post-hoc test using GraphPad Prism. Data were collected from somites 3–13 (~320 µm). (D) Scatter plot of myelinated nerve volumes at 7 dpf (mean ± SEM: DMSO: WT: 5.6 ± 0.4, cd59uva48: 4.1 ± 0.2; Dex: WT: 4.9 ± 0.1, cd59uva48: 5.4 ± 0.2; p--values: WT DMSO vs. cd59uva48 DMSO: p=0.0009, cd59uva48 DMSO vs. cd59uva48 Dex: p=0.0006; dot = 1 fish). These data were compared with a two-way ANOVA with Tukey’s post-hoc test using GraphPad Prism. Data were collected from somite 12 (~110 µm). All data were normalized to units per 100 µm. All images were acquired with confocal imaging. Scale bars: (A) 25 µm; inset, 25 µm; (B) 10 µm.
|
