
FIGURE
Fig. 2
- ID
- ZDB-FIG-220601-56
- Publication
- Lopez et al., 2022 - A New Zebrafish Model to Measure Neuronal α-Synuclein Clearance In Vivo
- Other Figures
- All Figure Page
- Back to All Figure Page
Fig. 2
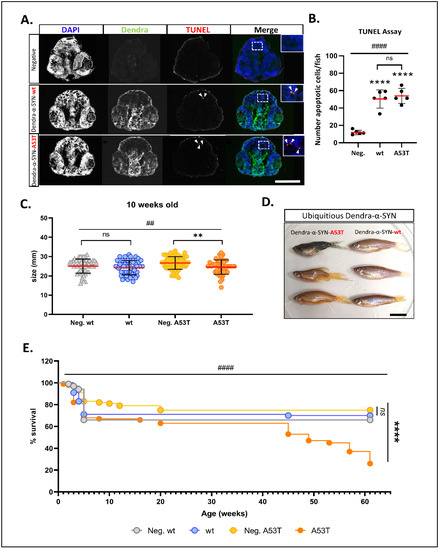
Figure 2. Characterisation of neuronal pathology and longevity in Dendra-α-SYN transgenic zebrafish. (A) Representative images of TUNEL labelling in the brains of larvae at 2 d.p.f. Pictures show DAPI, Dendra and TUNEL in transverse cryosections across the heads of embryos with pan-neuronal expression of Dendra-α-SYN-wt and A53T, compared to transgene-negative siblings imaged by epifluorescence microscope. Apoptotic nuclei are highlighted by white arrowheads in TUNEL images and shown at higher magnification in merge images. Scale bar represents 250 μm. (B) Quantification of the total number of apoptotic cells in 5 sections per fish detected by TUNEL assay. A significant increase in cell death was seen in fish expressing Dendra-α-SYN-wt (wt) or the A53T mutation, compared to transgene-negative siblings (Neg.). Data represented as mean (red line) ± s.d. (N = 5 fish per group, **** p < 0.0001 Dendra-α-SYN transgenics vs. Neg.; ns p > 0.05 Dendra-α-SYN-wt vs. A53T; #### p < 0.0001 ANOVA). (C) Graph represents the differences in body length of 10 weeks-old fish with ubiquitous expression of Dendra-α-SYN-wt and A53T related to their respective transgene-negative siblings (Neg. wt and Neg. A53T). Fish expressing mutant A53T showed significant reduced length (N = 47 fish per group, ** p < 0.005 vs. transgene-negative siblings; ## p < 0.005 ANOVA for whole data ser). (D) At 16 weeks old, fish with ubiquitous expression of Dendra-α-SYN-A53T (left) display overt morphological defects, such as bent spine and smaller heads, whereas Dendra-α-SYN-wt (right) appear normal. Scale bar represents 1 cm. (E) ubiquitous expression of Dendra-α-SYN-A53T reduced lifespan compared to Dendra-α-SYN-wt or non-expressors from 41 weeks old (N = 90 fish per group at beginning of the experiment, **** p < 0.0001 A53T vs. transgene-negative siblings; #### p < 0.0001 Log-rank (Mantel-Cox) for all 4 groups).
|
Expression Data
Expression Detail
Antibody Labeling
Phenotype Data
| Fish: | |
|---|---|
| Observed In: | |
| Stage Range: | Long-pec to Adult |
Phenotype Detail
Acknowledgments
This image is the copyrighted work of the attributed author or publisher, and
ZFIN has permission only to display this image to its users.
Additional permissions should be obtained from the applicable author or publisher of the image.
Full text @ Genes (Basel)