
Fig. 2
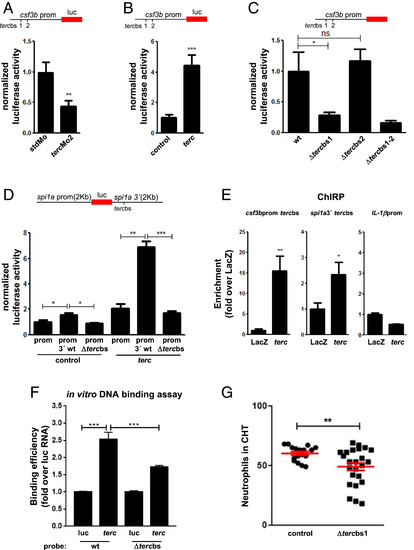
Telomerase RNA binds to target sequences in regulatory regions of zebrafish promyelopoietic genes and controls the activity of their promoters. (A and B) Activity of csf3a and csf3b promoters (∼2 kb upstream) in the CHT of larvae at 2 dpf after injection of the luciferase reporter constructs combined with tercMo2 or 200 pg/embryo of terc RNA. Data are representative results of three independent experiments. n = at least 30 larvae per group (see Materials and Methods); luc, luciferase. (C) Activity of tercbs-deleted csf3b promoter in the CHT of larvae at 2 dpf after injection of the luciferase reporter constructs. Data are representative results of three independent experiments. n = at least 30 larvae per group (see Materials and Methods). (D) Activity of the spi1a promoter (∼2 kb upstream) with wild-type (wt) or tercbs-deleted 3′ region (∼2 kb downstream) in CHT of larvae at 2 dpf after injection of the luciferase reporter constructs in combination with control or terc RNA. Data are representative results of three independent experiments. n = at least 30 larvae per group (see Materials and Methods). (E) qRT-PCR of ChIRP eluates of tercbs-containing DNA fragments encompassing the csf3b promoter and spi1a 3′ region. Data are representative results of two independent experiments; n = 20 WKM of adult fish. (F) qRT-PCR of in vitro DNA binding assay eluates. For each probe, data are the average of two independent experiments. luc, luciferase RNA. (G) Neutrophil counts in the CHT of mpx::GFP larvae at 3 dpf after injection of TALEN mRNAs to destroy the csf3b promoter tercbs1 in vivo (see Materials and Methods). Data are the average of two independent experiments; n = 17 and 24 larvae in control and tercbs-deleted groups, respectively. Data values shown are fold change over the value of the stdMo (standard morpholino) sample in A, the control sample in B, the csf3b wt promoter sample in C, the spi1a wt promoter + control sample in D, and the luc + wt probe sample in F. All data are mean + SEM. *P < 0.05, **P < 0.01, and ***P < 0.001 for Student’s t test in A, B, E, and G and for one-way ANOVA plus Bonferroni posttest in C, D, and F. ns, not significant. |