|
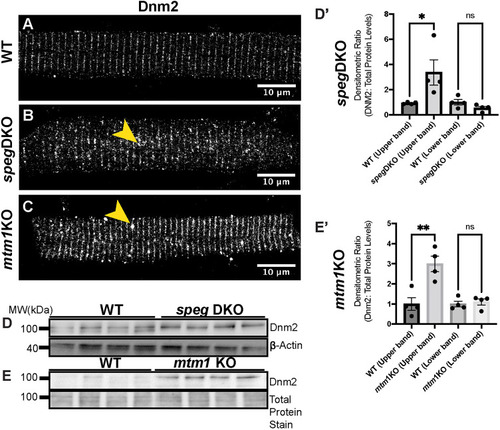
Dnm2 protein is upregulated in both speg-DKO and mtm1-KO zebrafish. (A-C) Myofibers were isolated at 5 dpf (speg-DKO) and 7 dpf (mtm1-KO), and stained with anti-Dnm2 (GTX127330, GeneTex). (A) In WT myofibers (5 dpf), Dnm2 is localized to the triads (transverse striations). (B,C) Similar striated patterns can be observed for Dnm2 in speg-DKO (B) and mtm1-KO (C), with occasional Dnm2 aggregations observed along the striations (yellow arrowheads). Scale bars: 10 µm. (D-E′) Western blot analysis shows increased Dnm2 protein levels in 5 dpf speg-DKO (D,D′) and 7 dpf mtm1-KO (E,E′) compared to WT. Each lane (D,E) or each dot (D′,E′) represents n=25 zebrafish (40 µg total protein). Densitometry was accomplished using Fiji ImageJ. Dnm2 protein level was normalized to β-actin loading controls in speg-DKO, or to REVERT total protein stains in mtm1-KO (as β-actin level is changed by the lack of Mtm1). Student's t-test: *P<0.05; **P<0.01; ns, not significant.
|