
Figure 3
- ID
- ZDB-FIG-220430-57
- Publication
- Peng et al., 2022 - Proper migration of lymphatic endothelial cells requires survival and guidance cues from arterial mural cells
- Other Figures
-
- Figure 1
- Figure 1—figure supplement 1.
- Figure 1—figure supplement 2.
- Figure 2
- Figure 2—figure supplement 1.
- Figure 2—figure supplement 2.
- Figure 2—figure supplement 3.
- Figure 3
- Figure 3—figure supplement 1.
- Figure 3—figure supplement 2.
- Figure 3—figure supplement 3.
- Figure 4
- Figure 4—figure supplement 1.
- Figure 4—figure supplement 2.
- Figure 5
- Figure 5—figure supplement 1.
- Figure 5—figure supplement 2.
- All Figure Page
- Back to All Figure Page
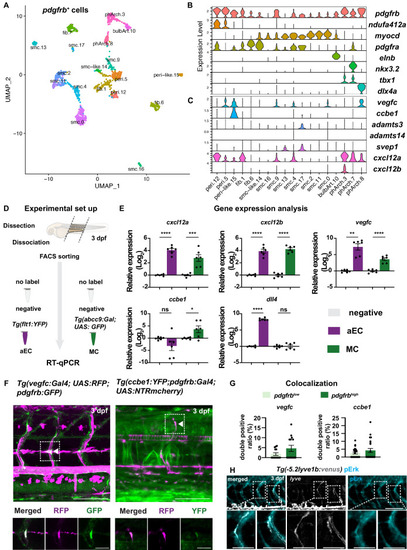
(A) Uniform Manifold Approximation and Projection (UMAP) plot of smooth muscle cells and pericytes subclustered from 5 days post fertilization (dpf) pdgfrb:egfp-positive cells. bulbArt – bulbous arteriosus, fib – fibroblast, peri – pericyte, peri-like – pericyte-like, phArch – pharyngeal arch mesenchymal cell, smc – smooth muscle cell. (B) Violin plot showing markers for pericytes (pdgfrb, ndufa4l2a), smooth muscle (myocd), fibroblasts (pdgfra), bulbous arteriosus (elnb), and pharyngeal arch mesenchyme (nkx3.2, tbx1, dlx4a). (C) Violin plot showing expression of known non-autonomous pro-lymphatic factors. Expression level values are log2 normalized across all cells. (D) Illustration of fluorescence activated cell sorting (FACS) and qPCR analysis on 3 dpf embryos. (E) qRT-qPCR of cxcl12a, cxcl12b, vegfc, ccbe1, and dll4 in FACS sorted trunk arterial endothelial cells (aECs) and MCs cells at 3 dpf as described in (D). Graph represents gene expression relative to geometric average of rpl13 and β-actin from three biological repeats (mean ± SEM). Unpaired two-tailed Student’s t-test or Mann-Whitney test was used. No significance (ns), p ≥ 0.5. *p < 0.05, ***p < 0.0005, ****p < 0.0001. (F) Confocal z-projections for immunohistochemistry of fluorescent proteins in trunks of Tg(vegfc:Gal4; UAS:RFP; pdgfrb:GFP) and confocal image of Tg(ccbe1:YFP;pdgfrb:Gal4; UAS:NTRmcherry) embryos at 3 dpf. Scale bar: 100 μm; 50 μm in enlarged images. (G) Left panel, quantification of colocalization of vegfc+ and pdgfrb+ cells based on immunohistochemistry in (F). Right panel, quantification of colocalization of ccbe1+ and pdgfrb+ cells based on confocal images in (F), data presented as double positive ratio (mean ± SEM). Ns, no significance. (H) Confocal z-projections for immunohistochemistry of endogenous pERK (cyan, right) in migrating lymphatic endothelial cells (LECs) in trunks of Tg(–5.2lyve1b:venus) embryos (α-GFP, grey, middle) (n = 10) at 3 dpf. Scale bar: 100 μm; 50 μm in enlarged images.
|