|
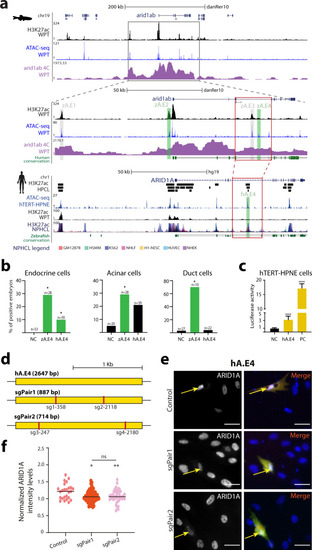
The zebrafish and human <italic>arid1ab/ARID1A</italic> regulatory landscapes contain an equivalent pancreatic enhancer.a Genomic landscape of the zebrafish arid1ab gene, showing profiles for H3K27ac ChIP-seq (black), ATAC-seq (blue) and 4 C with viewpoint in the arid1ab promoter (magenta) in adult zebrafish pancreas (top); zoom-in in arid1ab regulatory landscape (middle). Human ARID1A genomic landscape (bottom) with H3K27ac enriched intervals from human pancreatic cell lines (HPCL, black bars, top-to-bottom: PT-45-P1, CFPAC-1 and HPAF-II), H3K27ac profile from human pancreas (WPT, black) and from non-pancreatic human cell lines (NPHCL; GM12878, H1-hESC, HSMM, HUVEC, K562, NHEK and NHLF; Data from ENCODE). Human/zebrafish sequence conservation (dark green). Tested putative enhancers are highlighted in grey (zA.E1 and zA.E3; no enhancer activity) and green (zA.E2, zA.E4 and hA.E4; enhancer activity). Zebrafish/human syntenic box (red box). b Transient in vivo enhancer reporter assays of zA.E4 and hA.E4 showing the percentage of zebrafish embryos with GFP expression in endocrine, acinar and duct cells (two-sided chi-square test with Yates correction; *p < 0.05; Endocrine cells: zA.E4, p = 0.0001; hA.E4, p = 0.0294; Acinar cells: zA.E4, p = 0.0391; hA.E4, p = 0.1167; Duct cell: zA.E4, p = 0.00001; hA.E4, p = 0.9731). Number of analysed embryos (n). Negative control (NC). c Luciferase enhancer reporter assays performed in human hTERT-HPNE cells for hA.E4, showing luc2/Nluc ratios, relative to the negative control (two-sided t-test; ****p < 0.0001; hA.E4 p-value = 0.0001; PC p-value < 0.0001). Data from three biological replicates (grey dots, n = 3) and Mean±SD (error bar). Negative control (NC). Positive control (PC). d Strategy for CRISPR-Cas9 deletions in the hA.E4 locus, indicating sgRNA target sites. e Representative images of transfected hTERT-HPNE human cells expressing pairs of sgRNAs and Cas9 (arrows). In control, sgRNAs target a H3K27ac depleted region, while sgRNAs in sgPair1 and sgPair2 target the hA.E4 locus. Left column show anti-ARID1A (grey) and right column GFP (green), mCherry (red) and DAPI (blue; nuclei). Representative images from three biological replicates. Scale bar: 40 μm. f Normalized ARID1A levels from immunocytochemistry images. Two-sided t-test depicted for p ≤ 0.05(*), p ≤ 0.01(**) and not significant (ns; p-values of: Control vs sgPair1 = 0.0208, Control vs sgPair2 = 0.0044, sgPair1 vs sgPair2 = 0.6227). A black line represents the mean of values. Data from three biological replicates. Data included in Source Data file for b, c, f.
|