
FIGURE
FIGURE 5
- ID
- ZDB-FIG-220430-42
- Publication
- Rock et al., 2022 - Detailed Analysis of Zebrafish Larval Behaviour in the Light Dark Challenge Assay Shows That Diel Hatching Time Determines Individual Variation
- Other Figures
- All Figure Page
- Back to All Figure Page
FIGURE 5
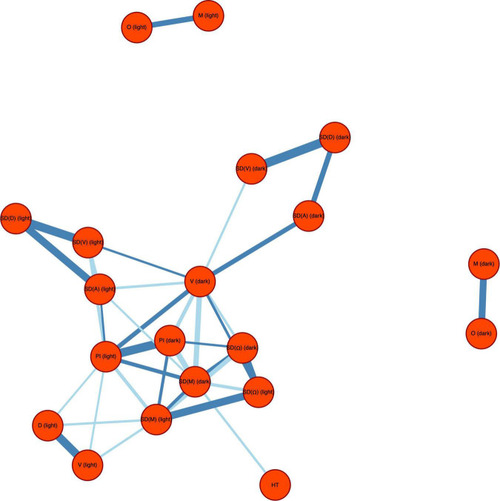
Network of non-zero partial correlations between the explanatory variables for swimming behaviour during the light dark challenge assay: distance moved (D), velocity (V), acceleration (A), angular velocity (Ω), meandering (M), percentage immobility (PI), and hatching time (HT) is represented by colour. The network is thresholded to lFDR < 0.20. Positive partial correlations are indicated by dark blue lines and negative partial correlations by light blue lines. Line width corresponds to the strength of correlation. |
Expression Data
Expression Detail
Antibody Labeling
Phenotype Data
Phenotype Detail
Acknowledgments
This image is the copyrighted work of the attributed author or publisher, and
ZFIN has permission only to display this image to its users.
Additional permissions should be obtained from the applicable author or publisher of the image.
Full text @ Front. Physiol.