FIGURE

Figure 7

ID
ZDB-FIG-220416-27
Publication
Garg et al., 2022 - A Markerless Pose Estimator Applicable to Limbless Animals
Other Figures
All Figure Page
Back to All Figure Page
Figure 7

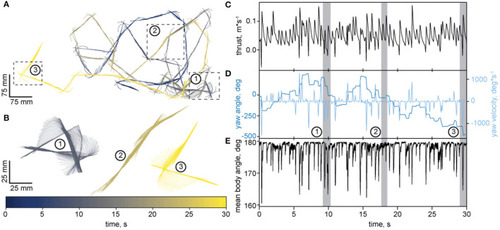
An example trajectory of an adult zebrafish traced with LACE. (A) Top view of the trajectory. The body's pseudo-skeleton is plotted as a line every 50 ms. Time is color coded by the color-bar. Three segments of the trajectory were chosen for a close up representation in B. 1 and 3 depicts fast turns and 2 shows a phase of undulatory body wave propulsion. (B) Enlarged view of the three segments from A. The pseudo-skeleton is now plotted every 5 ms. Time is encoded by the color bar. (C–E) show quantification of the trajectory over time. The gray areas mark the time in which the 3 segments (subplot B) occurred. (C) Thrust velocity in m*s−1. (D) is a YY-plot. The dark blue axis presents the yaw angle in degrees (shown in the same color). The light blue axis shows the yaw velocity in °*s−1 (shown in the same color). (E) depicts the mean angle of the pseudo-skeleton parts to each other. If the pseudo-skeleton is a perfect line, the angle is 180° and should decrease the more the skeleton is bent.

Expression Data

Expression Detail
Antibody Labeling
Phenotype Data

Phenotype Detail
Acknowledgments
This image is the copyrighted work of the attributed author or publisher, and ZFIN has permission only to display this image to its users. Additional permissions should be obtained from the applicable author or publisher of the image. Full text @ Front. Behav. Neurosci.