
Figure 3
- ID
- ZDB-FIG-220409-49
- Publication
- Gupta et al., 2022 - Cilia proteins are biomarkers of altered flow in the vasculature
- Other Figures
- All Figure Page
- Back to All Figure Page
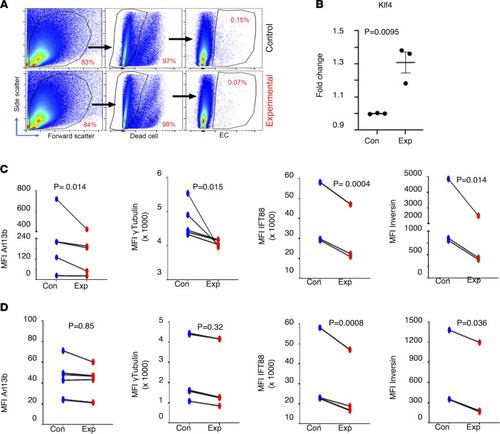
Shear stress results in ECs with fewer cilia proteins in vivo. Flk1mCherry Arl13bGFP double-transgenic zebrafish embryos at 29.5 hpf were subjected to 32°C temperature for 3 hours. Single cells were harvested from dechorionated embryos, and expression of cilia-specific proteins was quantified by flow cytometry in live ECs (mCherry+) versus non-ECs (mCherry–). Representative dot plots show the gating strategy as applied during FACS analysis to identify ECs (A). Stress-responsive protein Klf4 was quantified in ECs (B). Protein quantification was done by measuring MFI. Cilia-specific proteins were quantified in ECs (C) as well as non-ECs (D). Arl13b expression is marked by enhanced green fluorescent protein expression. For Arl13b n = 6 (for EC and non-EC); γ-tubulin n = 5 (for EC and non-EC); Ift88 n = 4 (EC) and n = 5 (non-EC); Inversin (n = 3 for EC and non-EC); Klf4 n = 3 (for EC and non-EC). A linear mixed model was used to examine the differences between treatment group and control group within EC (mCherry+) or non-EC (mCherry–). Time processed nested within day was treated as random. ARL13b and Inversin expression data were log-transformed to improve fit. |