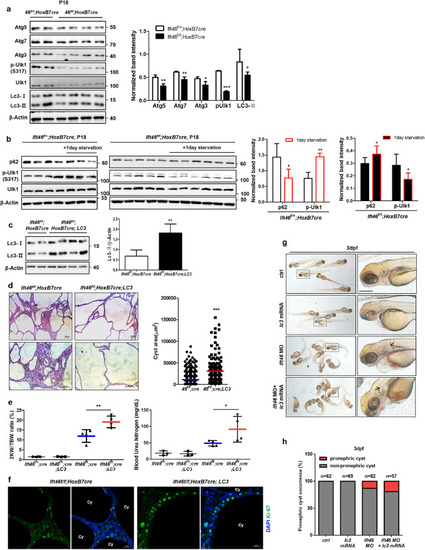
(a) Reduced expression of autophagy-regulating proteins including Atg5, Atg7, Atg3, p-Ulk1 (S317) and Lc3 in Ift46flox/flox; HoxB7-Cre mice. (b) Inhibited autophagy flux upon 1-day starvation in Ift46flox/flox; HoxB7-Cre mice. (c) The protein expression level of Lc3 in Ift46flox/flox; HoxB7-Cre; Lc3. (d) Haematoxylin and eosin (H&E)-stained sections of Ift46flox/flox; HoxB7-Cre; Lc3 mice at p21. Scale bar, 100 μm. Cyst area was quantified by Image J program. Data are shown as mean ± SD. (e) Ratio of the weight of two kidneys (2KW) to the total body weight (TBW) and blood urea nitrogen (BUN) level of Ift46flox/flox; HoxB7-Cre mice at p21. (f) Staining of cystic kidney tissues of Ift46flox/flox; HoxB7-Cre mice with or without Lc3 overexpression for Ki-67 to reveal changes in cell proliferation. Scale bar, 20 μm. Data are shown as mean ± SD; n ≥ 3 and P < 0.05 was considered statistically significant (* P < 0.05, ** P < 0.01, *** P < 0.001). (g) Zebrafish embryos injected with indicated morpholino (MO) and lc3 mRNA at 3 dpf. Arrows indicate pronephric cysts. Scale bar, 0.3 mm. (h) Graph showing occurrence of pronephric cysts in indicated groups.
|
