
FIGURE
Figure 3
- ID
- ZDB-FIG-220329-17
- Publication
- Alkowari et al., 2022 - Functional Characterization of the MYO6 Variant p.E60Q in Non-Syndromic Hearing Loss Patients
- Other Figures
- All Figure Page
- Back to All Figure Page
Figure 3
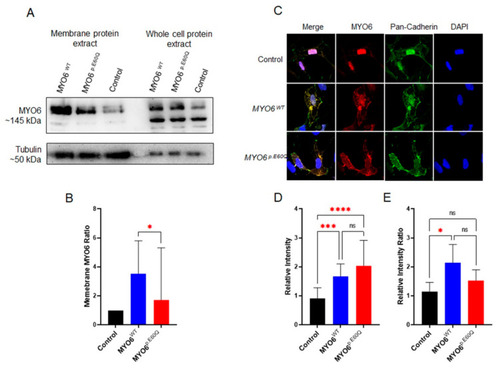
Figure 3. Cellular analysis of novel MYO6 variant. (A) Western blot of whole-cell lysates and membrane proteins from HeLa cells transfected with plasmids carrying human MYO6WT and MYO6p.E60Q. (B) Quantification ratio of the normalized integrated density of MYO6 expression from membrane/whole proteins. (C) Representative immunofluorescence staining images of HeLa cells labeled by MYO6 (red), pan-cadherin (green), and DAPI (blue). (D) Quantification of the relative fluorescence intensity of MYO6. (E) Quantification of the ratio of the normalized relative fluorescence intensity of MYO6/pan-cadherin. All values are represented as the mean ± SEM from independent experiments. Statistically significant differences were assessed by (B) unpaired t-test, * p < 0.05 or (D,E) one-way ANOVA followed by Tukey’s multiple comparisons, * p < 0.05; *** p = 0.0001; **** p < 0.0001.
|
Expression Data
Expression Detail
Antibody Labeling
Phenotype Data
Phenotype Detail
Acknowledgments
This image is the copyrighted work of the attributed author or publisher, and
ZFIN has permission only to display this image to its users.
Additional permissions should be obtained from the applicable author or publisher of the image.
Full text @ Int. J. Mol. Sci.