
FIG. 1.
- ID
- ZDB-FIG-220303-56
- Publication
- Charmantier et al., 2022 - Ontogenetic Changes in Blood Osmolality During the Postembryonic Development of Zebrafish (Danio rerio)
- Other Figures
- All Figure Page
- Back to All Figure Page
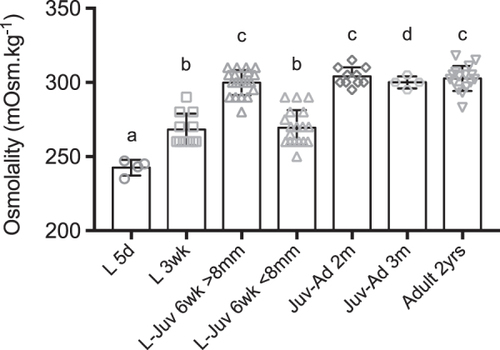
Ontogeny of osmoregulation of Danio rerio, in fresh water at 28°C. The graph represents the values of blood osmolality at different stages of postembryonic development. Dots show values measured on pooled larvae (L 5d) and individual values (from L 3wk to Ad). Columns show mean ± SD. Different letters indicate significant differences. a: significantly different (p < 0.05, p < 0.01, p < 0.005) from L-Juv 6wk >8 mm, Juv-Ad 2m, Juv-Ad 3m, Ad 2yrs. b: significantly different (p < 0.05, p < 0.01, p < 0.005) from L-Juv 6wk >8 mm, Juv-Ad 2m, Ad 2yrs. c: significantly different (p < 0.01, p < 0.005) from L 5d, L 3wk, L-Juv 6wk <8 mm. d: significantly different (p < 0.05) from L 5d. L: Larva; Juv: Juvenile; Ad: Adult; d: day; wk: week; m: month; yr: year. |