
FIGURE
Fig. 2.
- ID
- ZDB-FIG-220225-6
- Publication
- Diamond et al., 2022 - Computational anatomy and geometric shape analysis enables analysis of complex craniofacial phenotypes in zebrafish
- Other Figures
- All Figure Page
- Back to All Figure Page
Fig. 2.
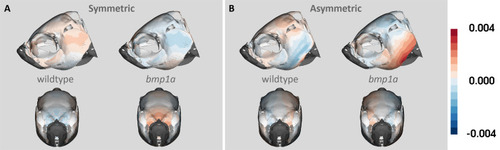
Heat map of (A) symmetric and (B) asymmetric components of shape variation. Lateral and anterior views are shown for each group (wild type and bmp1a) within both components of shape variation. Colors show variation in shape from the symmetric atlas, with deeper colors representing greater variation from the atlas. |
Expression Data
Expression Detail
Antibody Labeling
Phenotype Data
Phenotype Detail
Acknowledgments
This image is the copyrighted work of the attributed author or publisher, and
ZFIN has permission only to display this image to its users.
Additional permissions should be obtained from the applicable author or publisher of the image.
Full text @ Biol. Open