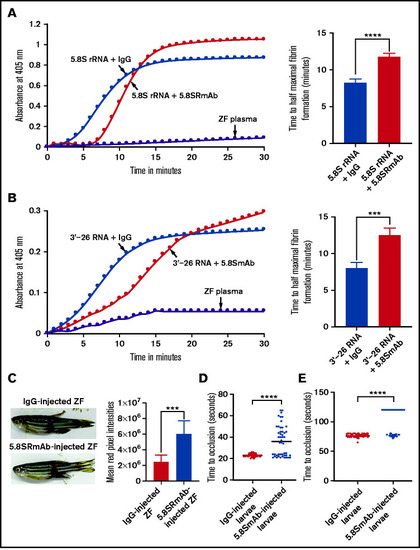
Inhibition of 5.8S rRNA– and 3'-26 RNA–mediated activation of zebrafish plasma in the presence of 5.8S RmAb. (A-B) Left graphs show the increasing fibrin formation with increasing time in the kinetic coagulation assay. (A) Left graph: curves were obtained from zebrafish plasma that contained 5.8S rRNA plus IgG or 5.8S rRNA plus 5.8S RmAb, and in the absence of RNA and antibody. Bar graph shows a significant shortening of the time to half-maximal fibrin formation (using data obtained from the left graph) in zebrafish plasma containing 5.8S rRNA plus IgG compared with zebrafish plasma containing 5.8S rRNA plus 5.8S RmAb (n = 4). The data for time to half-maximal fibrin formation (in minutes) were analyzed using Student t test and are shown as mean ± SEM . ****P < .0001. (B) Left graph: curves were obtained from zebrafish plasma that contained 3'-26 RNA plus IgG or 3'-26 RNA plus 5.8S RmAb, and without RNA, IgG, and antibody. Bar graph shows a significant shortening of the time to half-maximal fibrin formation (using data obtained from the left graph) in zebrafish plasma that contained 3'-26 RNA plus IgG compared with zebrafish plasma that contained 3'-26 RNA plus 5.8S RmAb (n = 4). The data for time to half-maximal fibrin formation (in minutes) were analyzed using Student t test and are shown as mean ± SEM. *** P < .001. For curves in panels A and B, the time (in minutes) was plotted against the absorbance at 405 nm at 25°C. (C) Left: adult zebrafish were IV injected with either IgG or 5.8S RmAb and were subjected to the caudal vessel bleeding assay. Bar graph shows increased total red pixel intensities in zebrafish injected with IgG compared with zebrafish injected with 5.8S RmAb (n = 6). The total red pixel intensity data were analyzed using Student t test and are shown as mean ± SEM. ***P < .001. (D-E) Inhibition of venous thrombosis (D) and arterial thrombosis (E) by 5.8S RmAb in zebrafish larvae. Graphs show a significant prolongation of the TTO (in seconds) in the caudal vein (D) or caudal artery (E) of larvae injected with 5.8S RmAb compared with larvae injected with IgG (n = 48). (D-E) The data were analyzed using Student t test and are shown as mean ± SEM. ****P < .0001.
|
