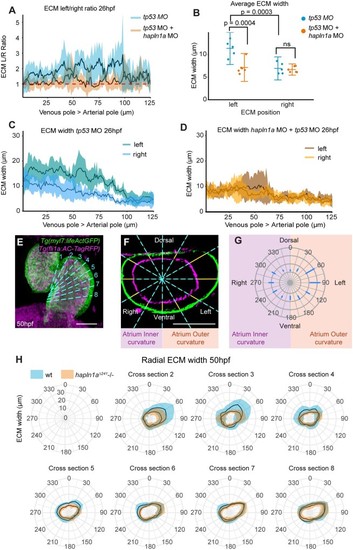
Hapln1a drives regionalized ECM expansion. (A) Quantification of ECM left/right width along the longitudinal axis of the heart at 26hpf in embryos injected with either tp53 MO (blue, n = 5) or hapln1a MO + tp53 MO (orange, n = 6). Mean ± SD are plotted. (B) Average ECM width on the left or right side of the heart tube in embryos injected with tp53 MO (blue, n = 5) or hapln1a MO + tp53 MO (orange, n = 6). tp53-injected controls display an expanded ECM on the left side of the heart tube compared to the right, (P = 0.0003, 2-way ANOVA) whereas embryos injected with hapln1a MO + tp53 MO have a reduced left ECM size when compared to tp53 MO injected (P = 0.0004), resulting in loss of left-sided ECM expansion. Mean ± SD are plotted. (C and D) Quantification of ECM width on the left and right sides of the heart tube from venous pole to arterial pole at 26hpf in embryos injected with tp53 MO (C, n = 5) or hapln1a MO + tp53 MO (D, n = 6). Mean ± SD are plotted. The cardiac ECM in tp53 morphants exhibits atrial and left side expansion, whereas the ECM in hapln1a morphants is more uniform in width from atrium to ventricle and is not expanded on the left side. Mean ± SD are plotted. (E) Maximum intensity projection of light-sheet z-stacks of 50hpf Tg(myl7:lifeActGFP); Tg(fli1a:AC-TagRFP) transgenic embryo. Dashed cyan line indicates position of optical cross-sections. (F) Example orthogonal view through the atrium of wild-type embryo in (E). Blue dashed lines indicate radial positions for measuring ECM thickness (yellow lines). Scale bar = 50μm. (G) Schematic of radial plot corresponding to radial ECM positions in (F). (H) Quantification of ECM width in atrial cross-sections at defined angular positions along the longitudinal axis of the atrium from AVC (cross-section 2) towards the venous pole (cross-section 8) at 50hpf in wild-type (blue) or hapln1aΔ241 mutants (orange). Asymmetric ECM width is reduced in the outer curvature close to the AVC (cross-sections 2–4) in hapln1aΔ241 mutants compared to wild-type siblings. Mean ± SD are plotted, radial-axis is consistent between plots, n ≥ 4 at each location.
|
